29
/
en
AIzaSyAYiBZKx7MnpbEhh9jyipgxe19OcubqV5w
April 1, 2024
226467
Portugal
PRT
true
2
1
Technicians in R&D (per million people)
2014,2013,2012,2011,2010,2009,2008,2007,2006,2005,2004,2003,2002,2001,2000,1999,1998,1997
This statistics in other country:
Timeline:
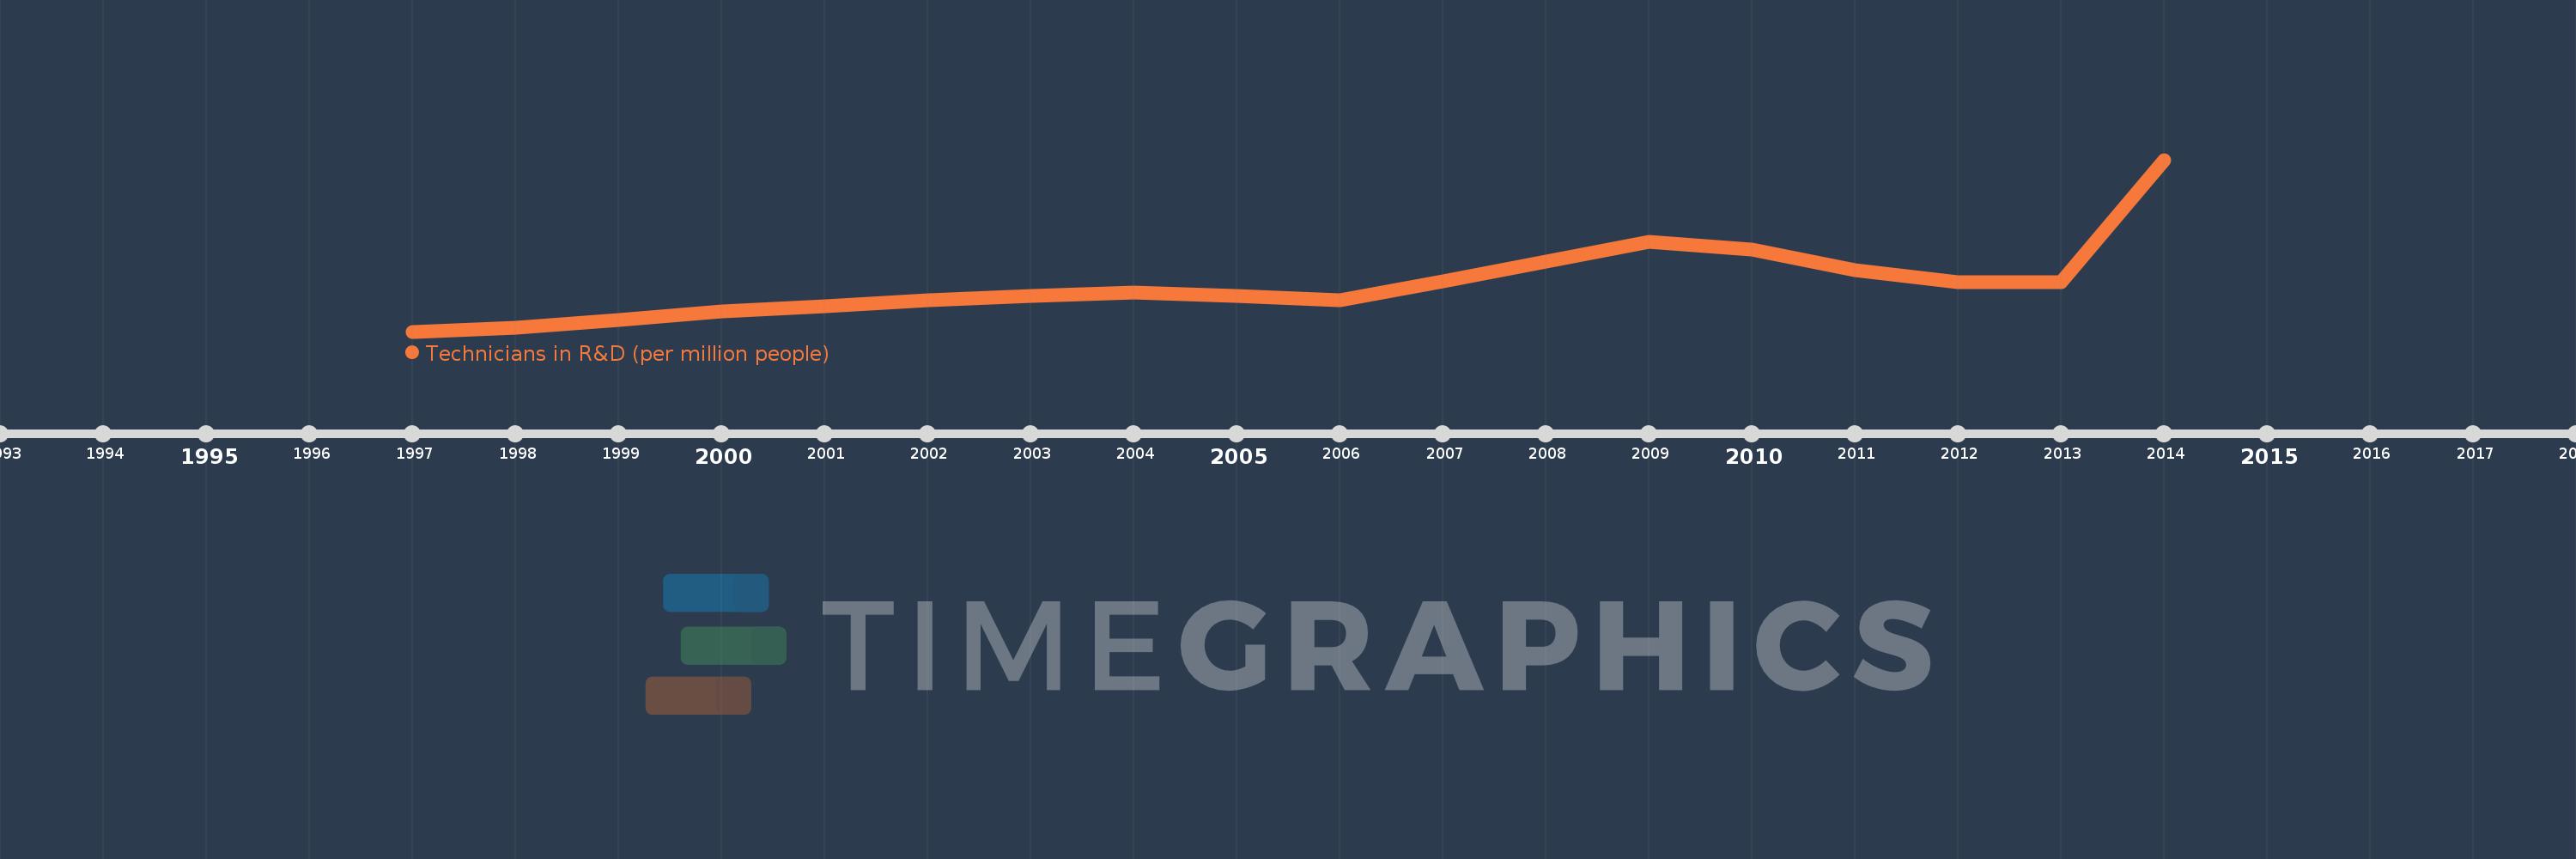
This timeline shows a graph from 1997 to 2014 of Portugal. No data until 1996. Number of actual observations by date: 18.
Source name:
World Development Indicators
Source organization:
United Nations Educational, Scientific, and Cultural Organization (UNESCO) Institute for Statistics.
Categories, topics:
Science & Technology
Last updated:
apr 23, 2017
Indicators value changes by year
Minimum:
176.154
jan 1, 1997
Maximum:
743.209
jan 1, 2014
At the date of observation
Value
Absolute change
Change from previous value
jan 1, 1997
176.154
+176.154
0.0%
jan 1, 1998
187.58
+11.426
6.49%
jan 1, 1999
214.959
+27.379
14.6%
jan 1, 2000
242.117
+27.158
12.63%
jan 1, 2001
260.358
+18.241
7.53%
jan 1, 2002
278.429
+18.07
6.94%
jan 1, 2003
292.545
+14.116
5.07%
jan 1, 2004
306.571
+14.026
4.79%
jan 1, 2005
292.441
-14.131
-4.61%
jan 1, 2006
278.469
-13.971
-4.78%
jan 1, 2007
342.813
+64.344
23.11%
jan 1, 2008
406.802
+63.989
18.67%
jan 1, 2009
473.418
+66.616
16.38%
jan 1, 2010
447.799
-25.619
-5.41%
jan 1, 2011
378.29
-69.509
-15.52%
jan 1, 2012
340.215
-38.075
-10.07%
jan 1, 2013
338.573
-1.642
-0.48%
jan 1, 2014
743.209
+404.636
119.51%
Ranking of countries by current statistics by years


Comments: