29
/
en
AIzaSyAYiBZKx7MnpbEhh9jyipgxe19OcubqV5w
April 1, 2024
209837
New Zealand
NZL
true
2
1
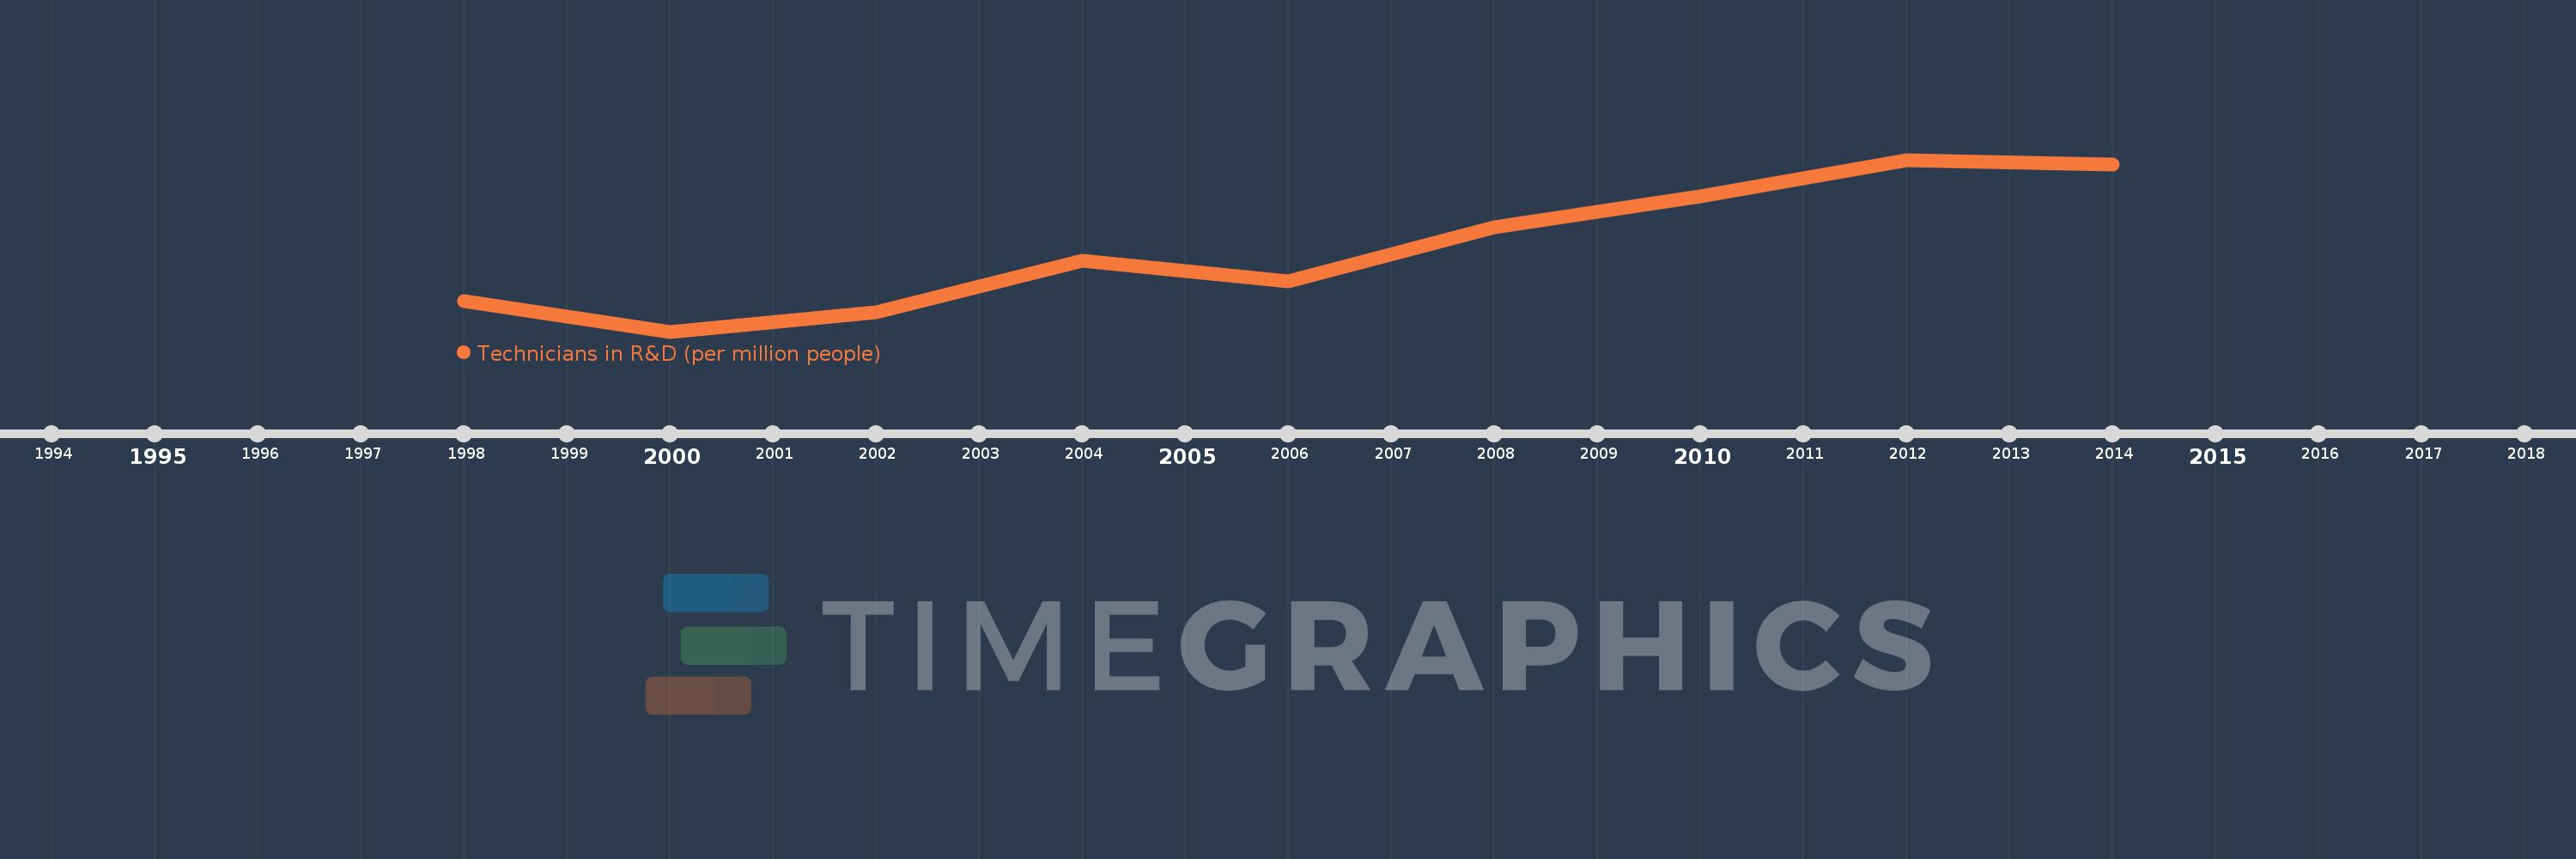
Technicians in R&D (per million people)
2014,2012,2010,2008,2006,2004,2002,2000,1998
This statistics in other country:
Timeline:
This timeline shows a graph from 1998 to 2014 of New Zealand. No data until 1997. Number of actual observations by date: 9.
Source name:
World Development Indicators
Source organization:
United Nations Educational, Scientific, and Cultural Organization (UNESCO) Institute for Statistics.
Categories, topics:
Science & Technology
Last updated:
apr 23, 2017
Indicators value changes by year
Minimum:
672.589
jan 1, 2000
Maximum:
1.022K
jan 1, 2012
At the date of observation
Value
Absolute change
Change from previous value
jan 1, 1998
733.968
+733.968
0.0%
jan 1, 2000
672.589
-61.38
-8.36%
jan 1, 2002
712.583
+39.995
5.95%
jan 1, 2004
817.125
+104.541
14.67%
jan 1, 2006
773.938
-43.187
-5.29%
jan 1, 2008
884.847
+110.909
14.33%
jan 1, 2010
947.074
+62.227
7.03%
jan 1, 2012
1.022K
+74.613
7.88%
jan 1, 2014
1.012K
-9.431
-0.92%
Ranking of countries by current statistics by years


Comments: