Download This statistics in other country:
Timeline:
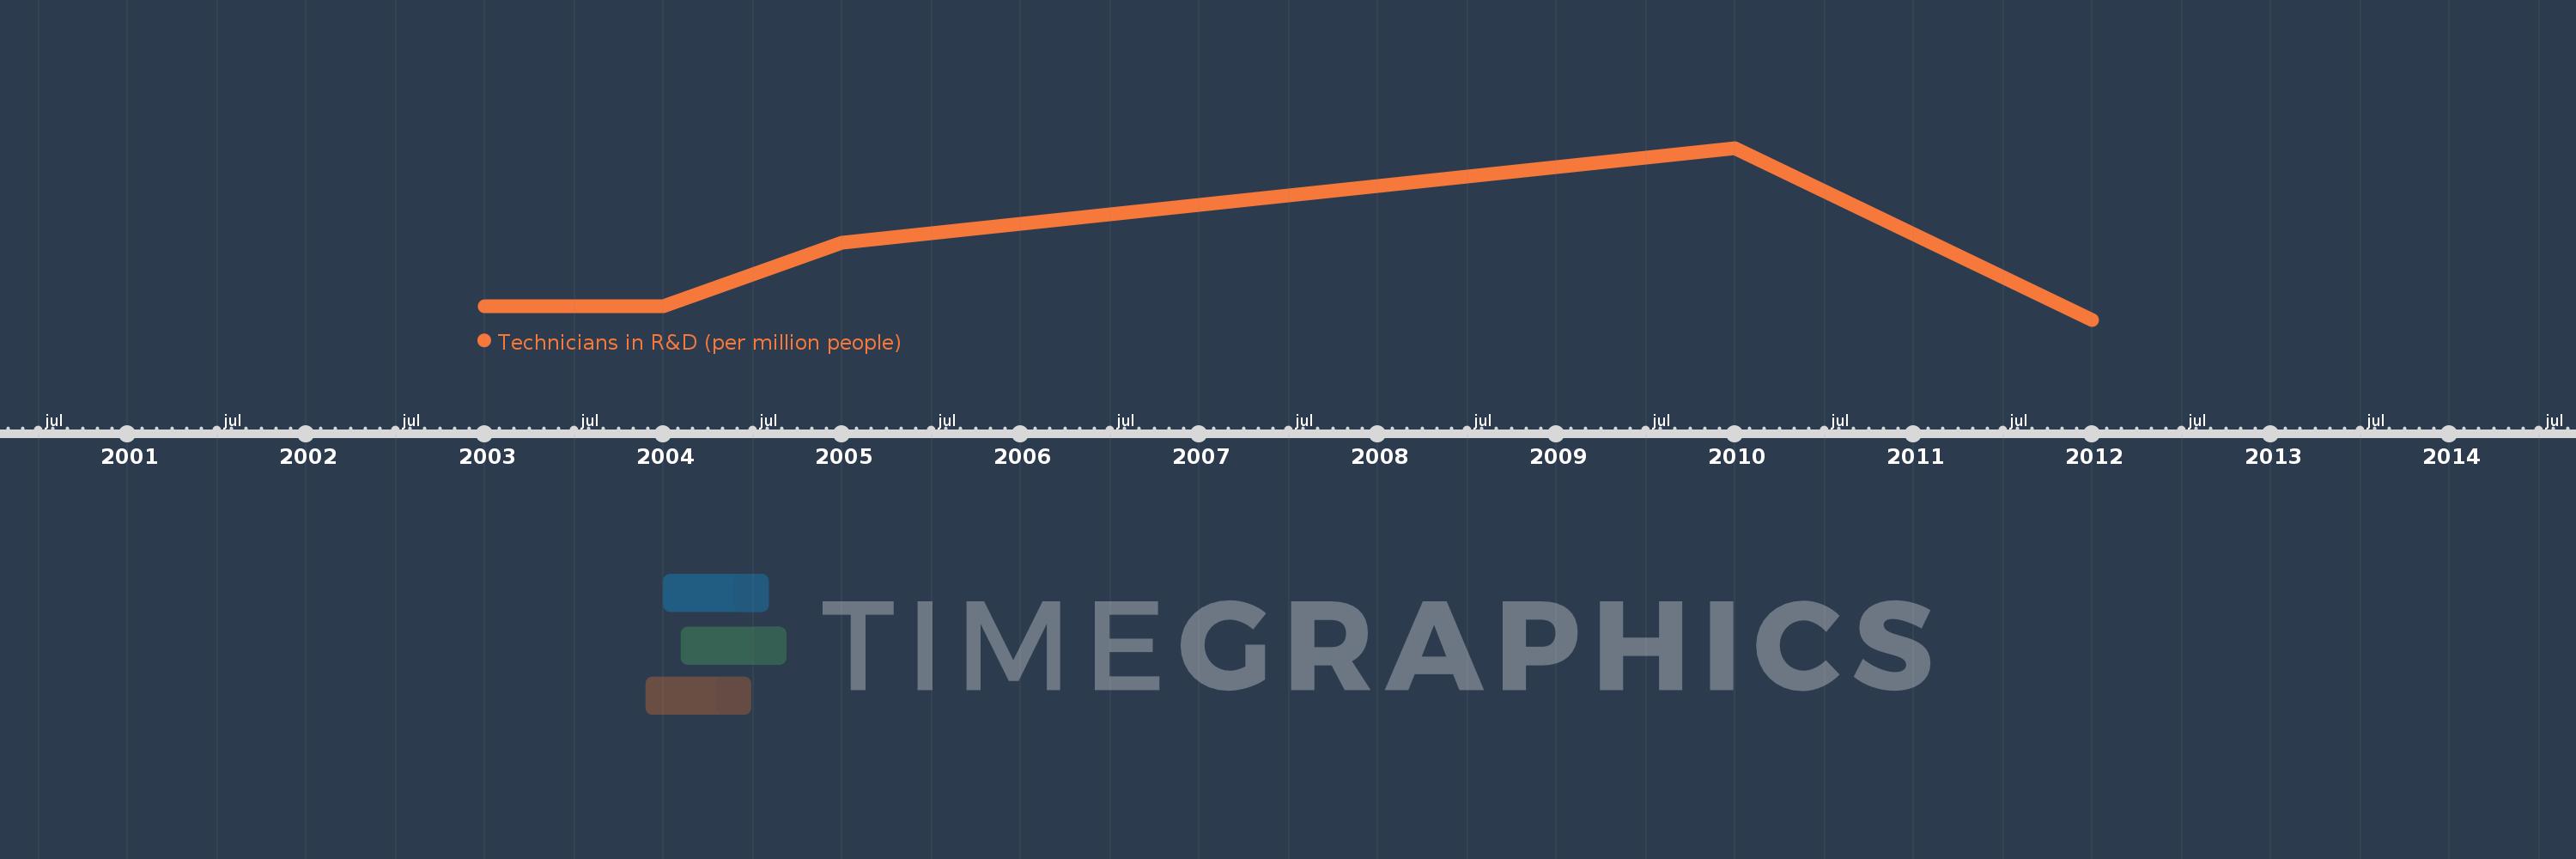
This timeline shows a graph from 2003 to 2012 of Lesotho. No data until 2002. Number of actual observations by date: 5.
Source name:
World Development Indicators
Source organization:
United Nations Educational, Scientific, and Cultural Organization (UNESCO) Institute for Statistics.
Categories, topics:
Science & Technology
Last updated:
apr 23, 2017
Indicators value changes by year
Maximum:
23.513
jan 1, 2010
At the date of observation
Value
Absolute change
Change from the previous value
jan 1, 2003
2.652
+2.652
0.0%
jan 1, 2004
2.633
-0.019
-0.7%
jan 1, 2005
10.983
+8.35
317.09%
jan 1, 2010
23.513
+12.53
114.08%
jan 1, 2012
0.885
-22.627
-96.23%
Ranking of countries by current statistics by years
