29
/
en
AIzaSyAYiBZKx7MnpbEhh9jyipgxe19OcubqV5w
April 1, 2024
242175
Slovak Republic
SVK
true
2
1
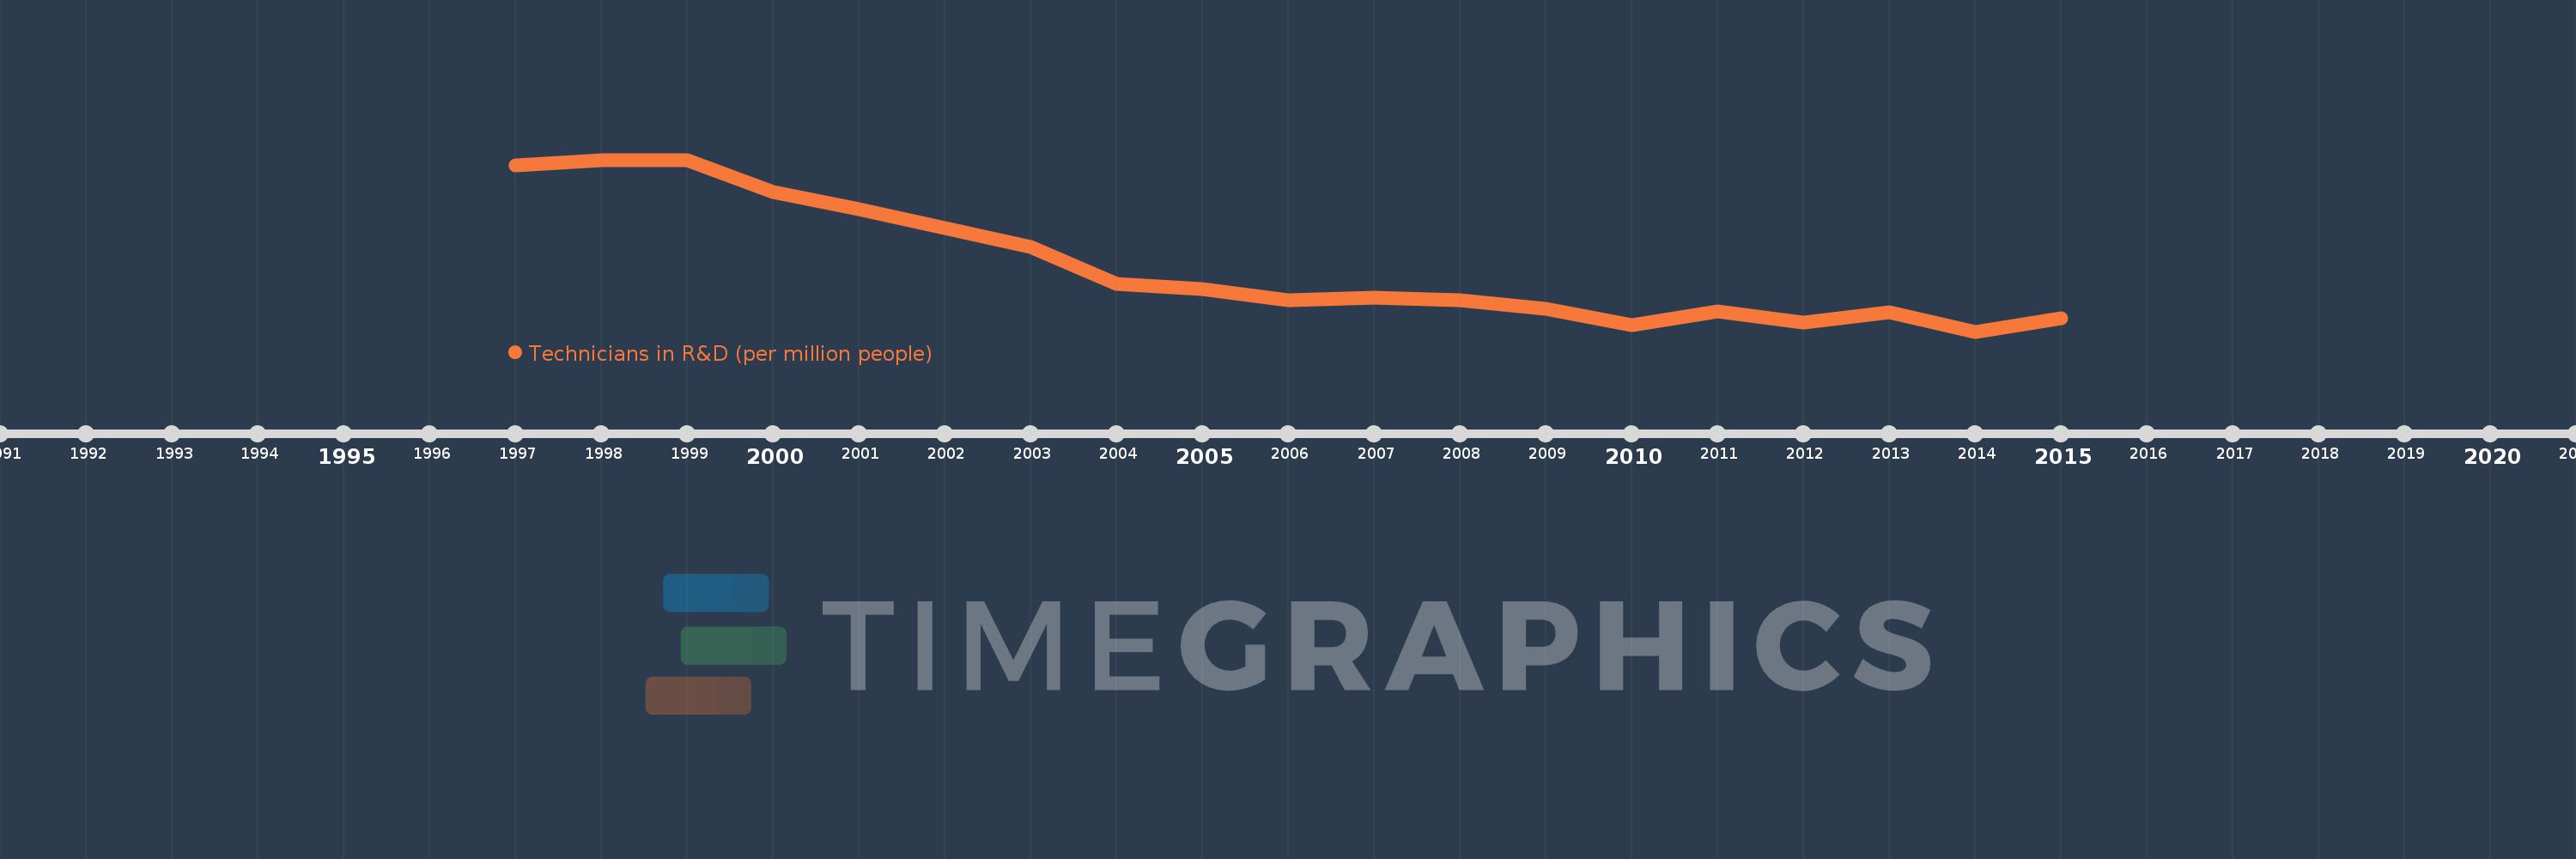
Technicians in R&D (per million people)
2015,2014,2013,2012,2011,2010,2009,2008,2007,2006,2005,2004,2003,2002,2001,2000,1999,1998,1997
This statistics in other country:
Timeline:
This timeline shows a graph from 1997 to 2015 of Slovak Republic. No data until 1996. Number of actual observations by date: 19.
Source name:
World Development Indicators
Source organization:
United Nations Educational, Scientific, and Cultural Organization (UNESCO) Institute for Statistics.
Categories, topics:
Science & Technology
Last updated:
apr 23, 2017
Indicators value changes by year
Minimum:
329.508
jan 1, 2014
Maximum:
804.642
jan 1, 1999
At the date of observation
Value
Absolute change
Change from previous value
jan 1, 1997
790.005
+790.005
0.0%
jan 1, 1998
802.828
+12.822
1.62%
jan 1, 1999
804.642
+1.814
0.23%
jan 1, 2000
716.454
-88.188
-10.96%
jan 1, 2001
667.834
-48.619
-6.79%
jan 1, 2002
616.944
-50.89
-7.62%
jan 1, 2003
562.995
-53.949
-8.74%
jan 1, 2004
461.136
-101.86
-18.09%
jan 1, 2005
446.21
-14.926
-3.24%
jan 1, 2006
416.847
-29.363
-6.58%
jan 1, 2007
423.833
+6.986
1.68%
jan 1, 2008
415.062
-8.771
-2.07%
jan 1, 2009
392.276
-22.786
-5.49%
jan 1, 2010
348.059
-44.217
-11.27%
jan 1, 2011
386.007
+37.948
10.9%
jan 1, 2012
354.863
-31.144
-8.07%
jan 1, 2013
383.861
+28.998
8.17%
jan 1, 2014
329.508
-54.353
-14.16%
jan 1, 2015
366.947
+37.438
11.36%
Ranking of countries by current statistics by years


Comments: