Download This statistics in other country:
Timeline:
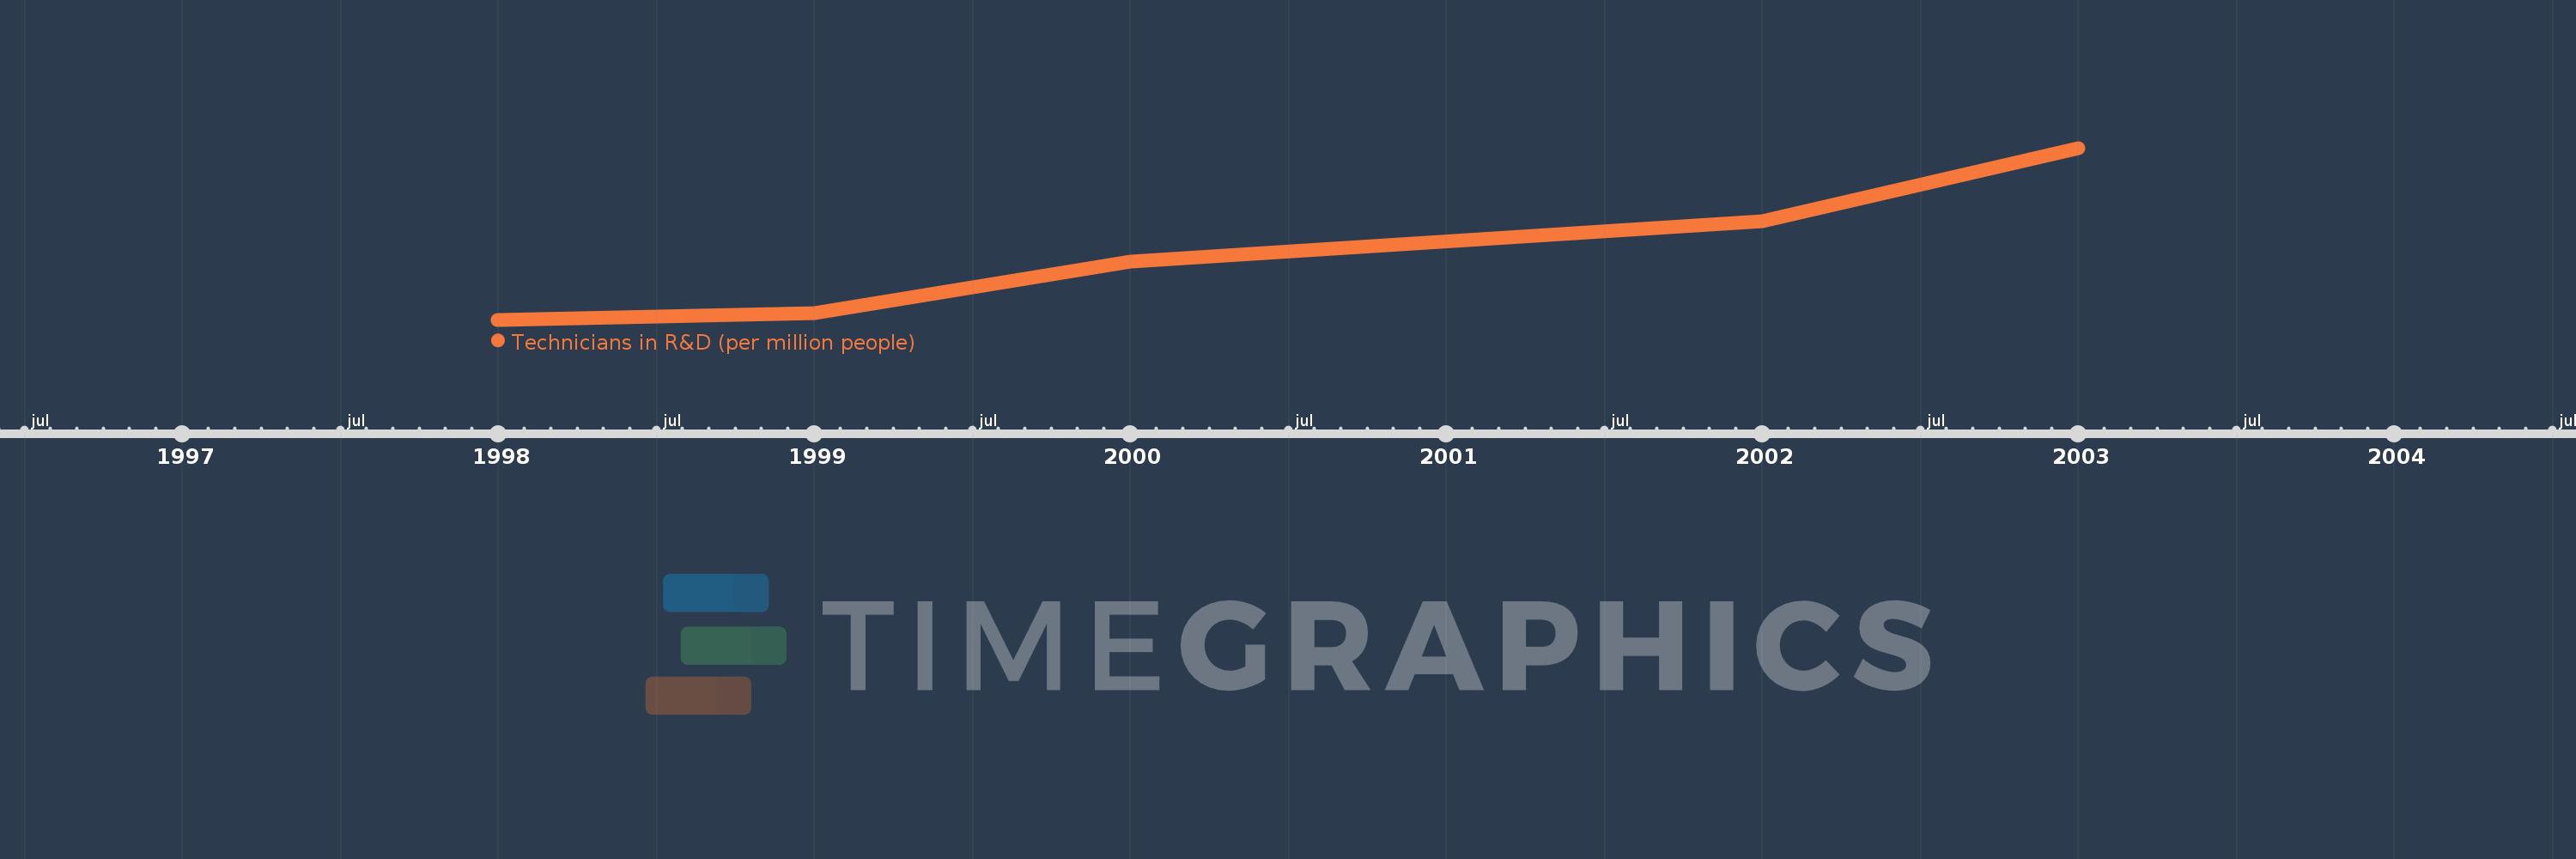
This timeline shows a graph from 1998 to 2003 of Myanmar. No data until 1997. Number of actual observations by date: 5.
Source name:
World Development Indicators
Source organization:
United Nations Educational, Scientific, and Cultural Organization (UNESCO) Institute for Statistics.
Categories, topics:
Science & Technology
Last updated:
apr 23, 2017
Indicators value changes by year
Maximum:
133.477
jan 1, 2003
At the date of observation
Value
Absolute change
Change from the previous value
jan 1, 1998
3.138
+3.138
0.0%
jan 1, 1999
7.869
+4.732
150.81%
jan 1, 2000
47.509
+39.64
503.72%
jan 1, 2002
77.87
+30.361
63.91%
jan 1, 2003
133.477
+55.607
71.41%
Ranking of countries by current statistics by years
