30
/
AIzaSyAYiBZKx7MnpbEhh9jyipgxe19OcubqV5w
April 1, 2024
270132
Turkey
TUR
true
2
1
Technicians in R&D (per million people)
2015,2014,2013,2012,2011,2010,2009,2008,2007,2006,2005,2004,2003,2002,2001,2000,1999,1998,1997
Public Timelines
FAQ
Menu
Public Timelines
FAQ
For education
For educational institutions
For teachers
For students
Open cabinet
Create
Close
Create a timeline
Public timelines
Library
FAQ
Download
Global statistics library
→
Turkey
→
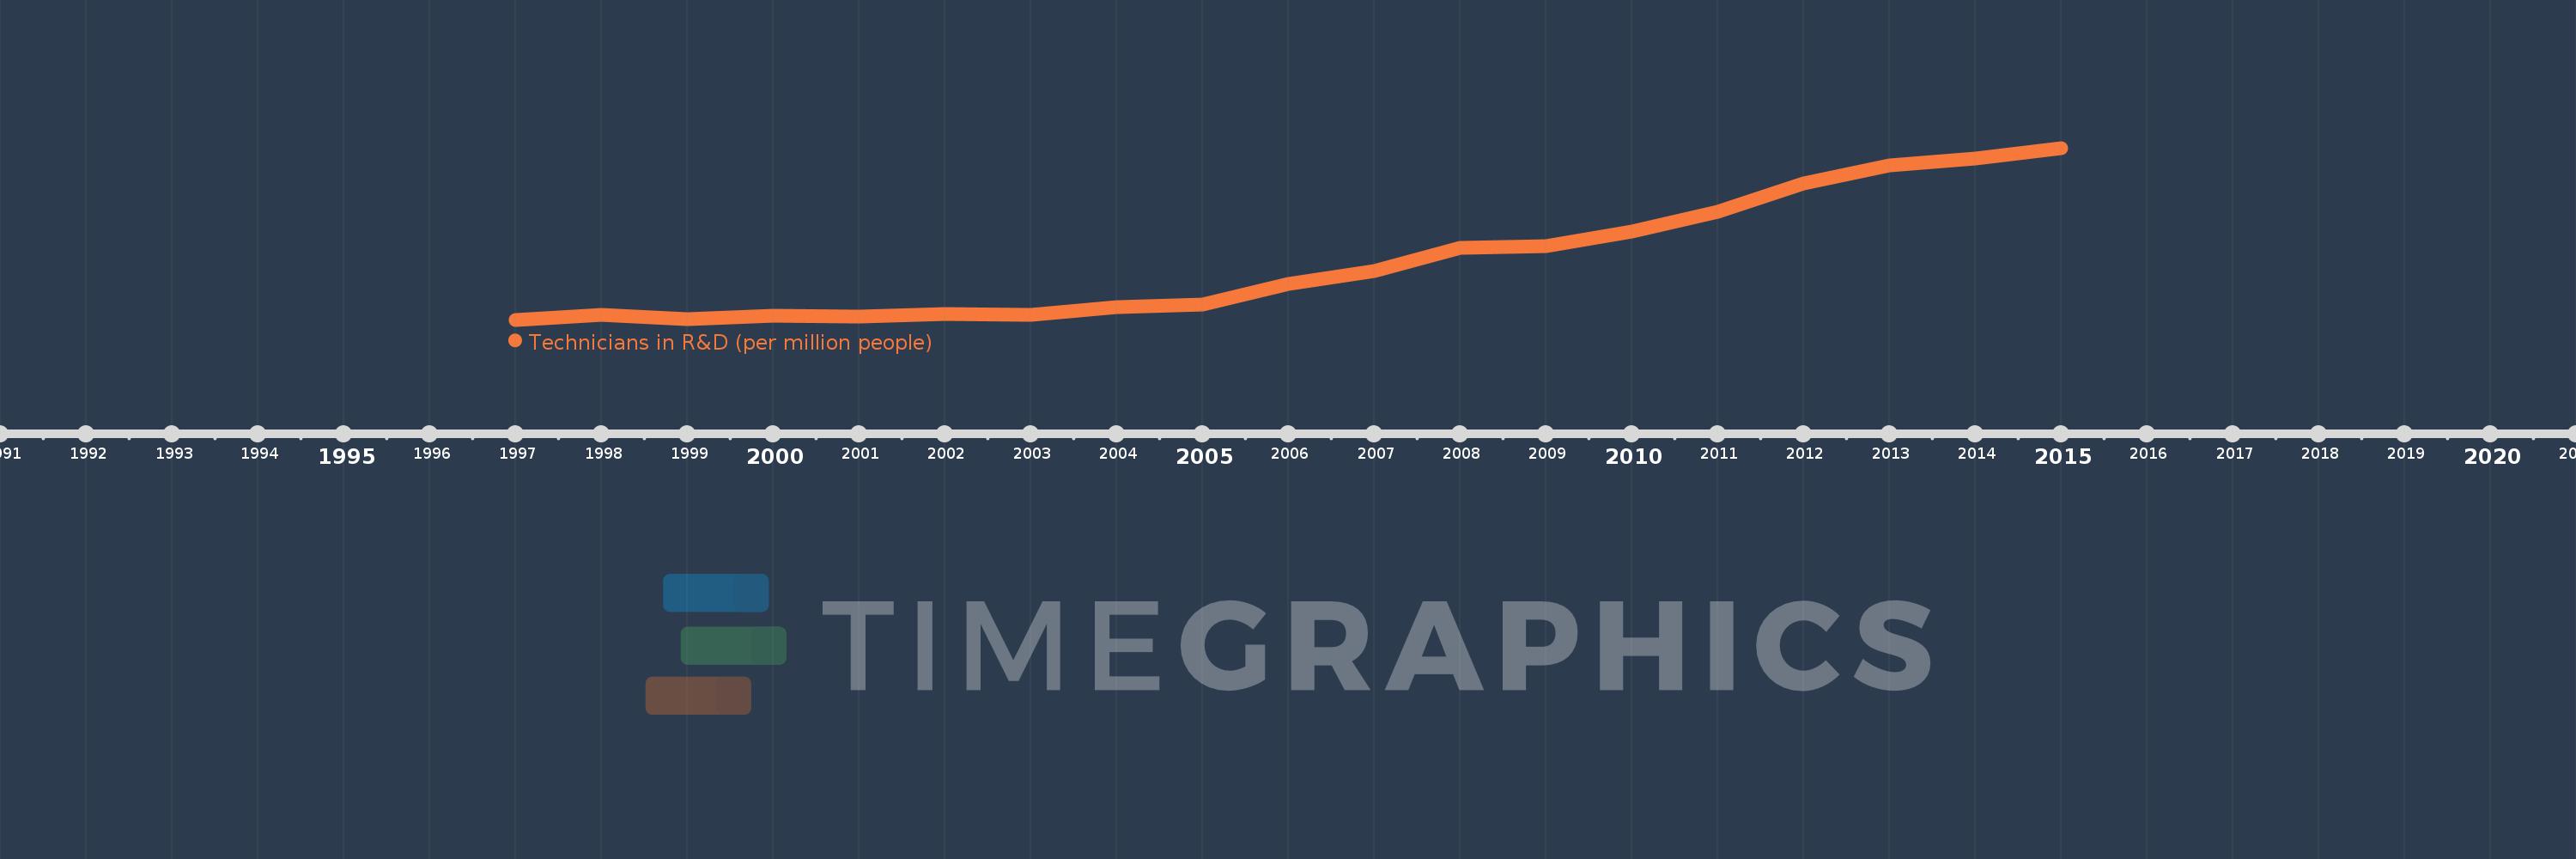
Technicians in R&D (per million people)
This statistics in other country:
Albania
Algeria
Angola
Argentina
Australia
Austria
Bahrain
Belgium
Bolivia
Bosnia and Herzegovina
Botswana
Brazil
Bulgaria
Burkina Faso
Cabo Verde
Cambodia
Canada
Central Europe and the Baltics
Chile
Congo, Rep.
Croatia
Cyprus
Czech Republic
Denmark
Ecuador
Egypt, Arab Rep.
Estonia
Ethiopia
Euro area
Europe & Central Asia
Europe & Central Asia (excluding high income)
Europe & Central Asia (IDA & IBRD countries)
European Union
Faroe Islands
France
Gambia, The
Georgia
Germany
Ghana
Greece
Greenland
Guatemala
Hong Kong SAR, China
Hungary
Iceland
India
Iran, Islamic Rep.
Iraq
Ireland
Israel
Italy
Japan
Jordan
Kazakhstan
Kenya
Korea, Rep.
Kuwait
Latin America & Caribbean
Latin America & Caribbean (excluding high income)
Latin America & the Caribbean (IDA & IBRD countries)
Latvia
Lesotho
Lithuania
Luxembourg
Macao SAR, China
Macedonia, FYR
Madagascar
Malawi
Malaysia
Mali
Malta
Mauritius
Mexico
Moldova
Montenegro
Morocco
Mozambique
Myanmar
Nepal
Netherlands
New Zealand
Niger
Nigeria
Oman
Pakistan
Panama
Paraguay
Philippines
Poland
Portugal
Puerto Rico
Qatar
Romania
Russian Federation
Rwanda
Senegal
Serbia
Seychelles
Singapore
Slovak Republic
Slovenia
South Africa
South Asia
South Asia (IDA & IBRD)
Spain
Sri Lanka
Sweden
Switzerland
Tanzania
Thailand
Togo
Tunisia
Turkey
Uganda
Ukraine
United Kingdom
Uzbekistan
West Bank and Gaza
Zambia
Zimbabwe
Timeline:
This timeline shows a graph from
1997
to
2015
of Turkey. No data until
1996
. Number of actual observations by date:
19
.
Source name:
World Development Indicators
Source organization:
United Nations Educational, Scientific, and Cultural Organization (UNESCO) Institute for Statistics.
Categories, topics:
Science & Technology
Last updated:
apr 23, 2017
Indicators value changes by year
Meaning:
92.678
Minimum:
34.213
jan 1, 1997
Maximum:
207.469
jan 1, 2015
At the date of observation
Value
Absolute change
Change from the previous value
jan 1, 1997
34.213
+34.213
0.0%
jan 1, 1998
39.292
+5.079
14.85%
jan 1, 1999
35.146
-4.146
-10.55%
jan 1, 2000
38.06
+2.915
8.29%
jan 1, 2001
37.334
-0.727
-1.91%
jan 1, 2002
39.886
+2.552
6.84%
jan 1, 2003
39.416
-0.47
-1.18%
jan 1, 2004
46.806
+7.39
18.75%
jan 1, 2005
49.89
+3.084
6.59%
jan 1, 2006
70.038
+20.149
40.39%
jan 1, 2007
83.32
+13.282
18.96%
jan 1, 2008
106.737
+23.417
28.1%
jan 1, 2009
108.208
+1.471
1.38%
jan 1, 2010
123.118
+14.91
13.78%
jan 1, 2011
143.158
+20.04
16.28%
jan 1, 2012
172.078
+28.92
20.2%
jan 1, 2013
189.519
+17.441
10.14%
jan 1, 2014
197.197
+7.678
4.05%
jan 1, 2015
207.469
+10.271
5.21%
Ranking of countries by current statistics by years
About & Feedback
Terms
Privacy
Library
2024
©
Time.Graphics
Support 24/7
Cabinet
Get premium
Donate
The service accepts bank transfer (ACH, Wire) or cards (Visa, MasterCard, etc). Processed by Stripe.
Secured with SSL
Excellent (Trustpilot Reviews)
Based on 115+ reviews
Write your own review on
Trustpilot.com
