This statistics in other country:
Timeline:
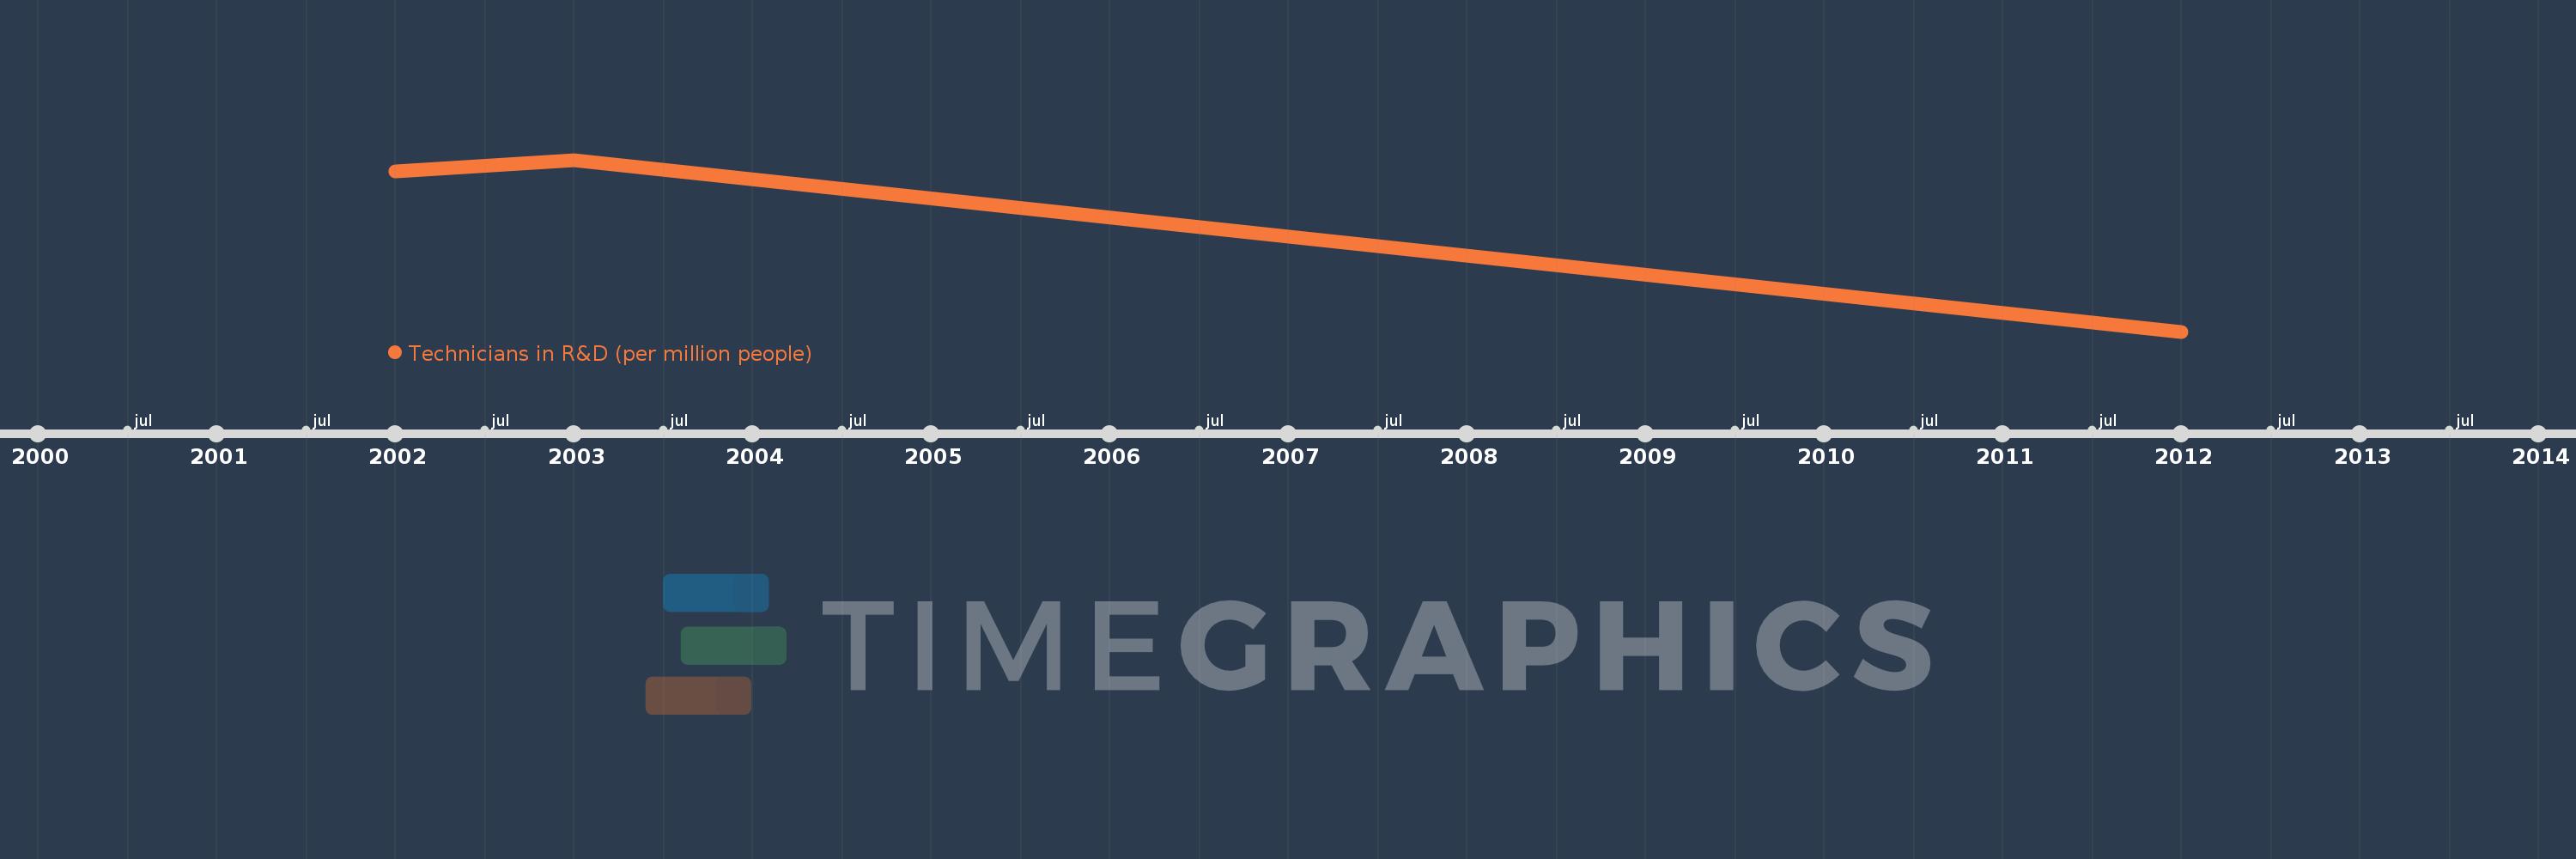
This timeline shows a graph from 2002 to 2012 of Cabo Verde. No data until 2001. Number of actual observations by date: 3.
Source name:
World Development Indicators
Source organization:
United Nations Educational, Scientific, and Cultural Organization (UNESCO) Institute for Statistics.
Categories, topics:
Science & Technology
Last updated:
apr 23, 2017
Indicators value changes by year
Maximum:
32.938
jan 1, 2003
At the date of observation
Value
Absolute change
Change from previous value
jan 1, 2002
31.295
+31.295
0.0%
jan 1, 2003
32.938
+1.643
5.25%
jan 1, 2012
8.078
-24.86
-75.47%
Ranking of countries by current statistics by years


Comments: