29
/
en
AIzaSyAYiBZKx7MnpbEhh9jyipgxe19OcubqV5w
April 1, 2024
182622
Luxembourg
LUX
true
2
1
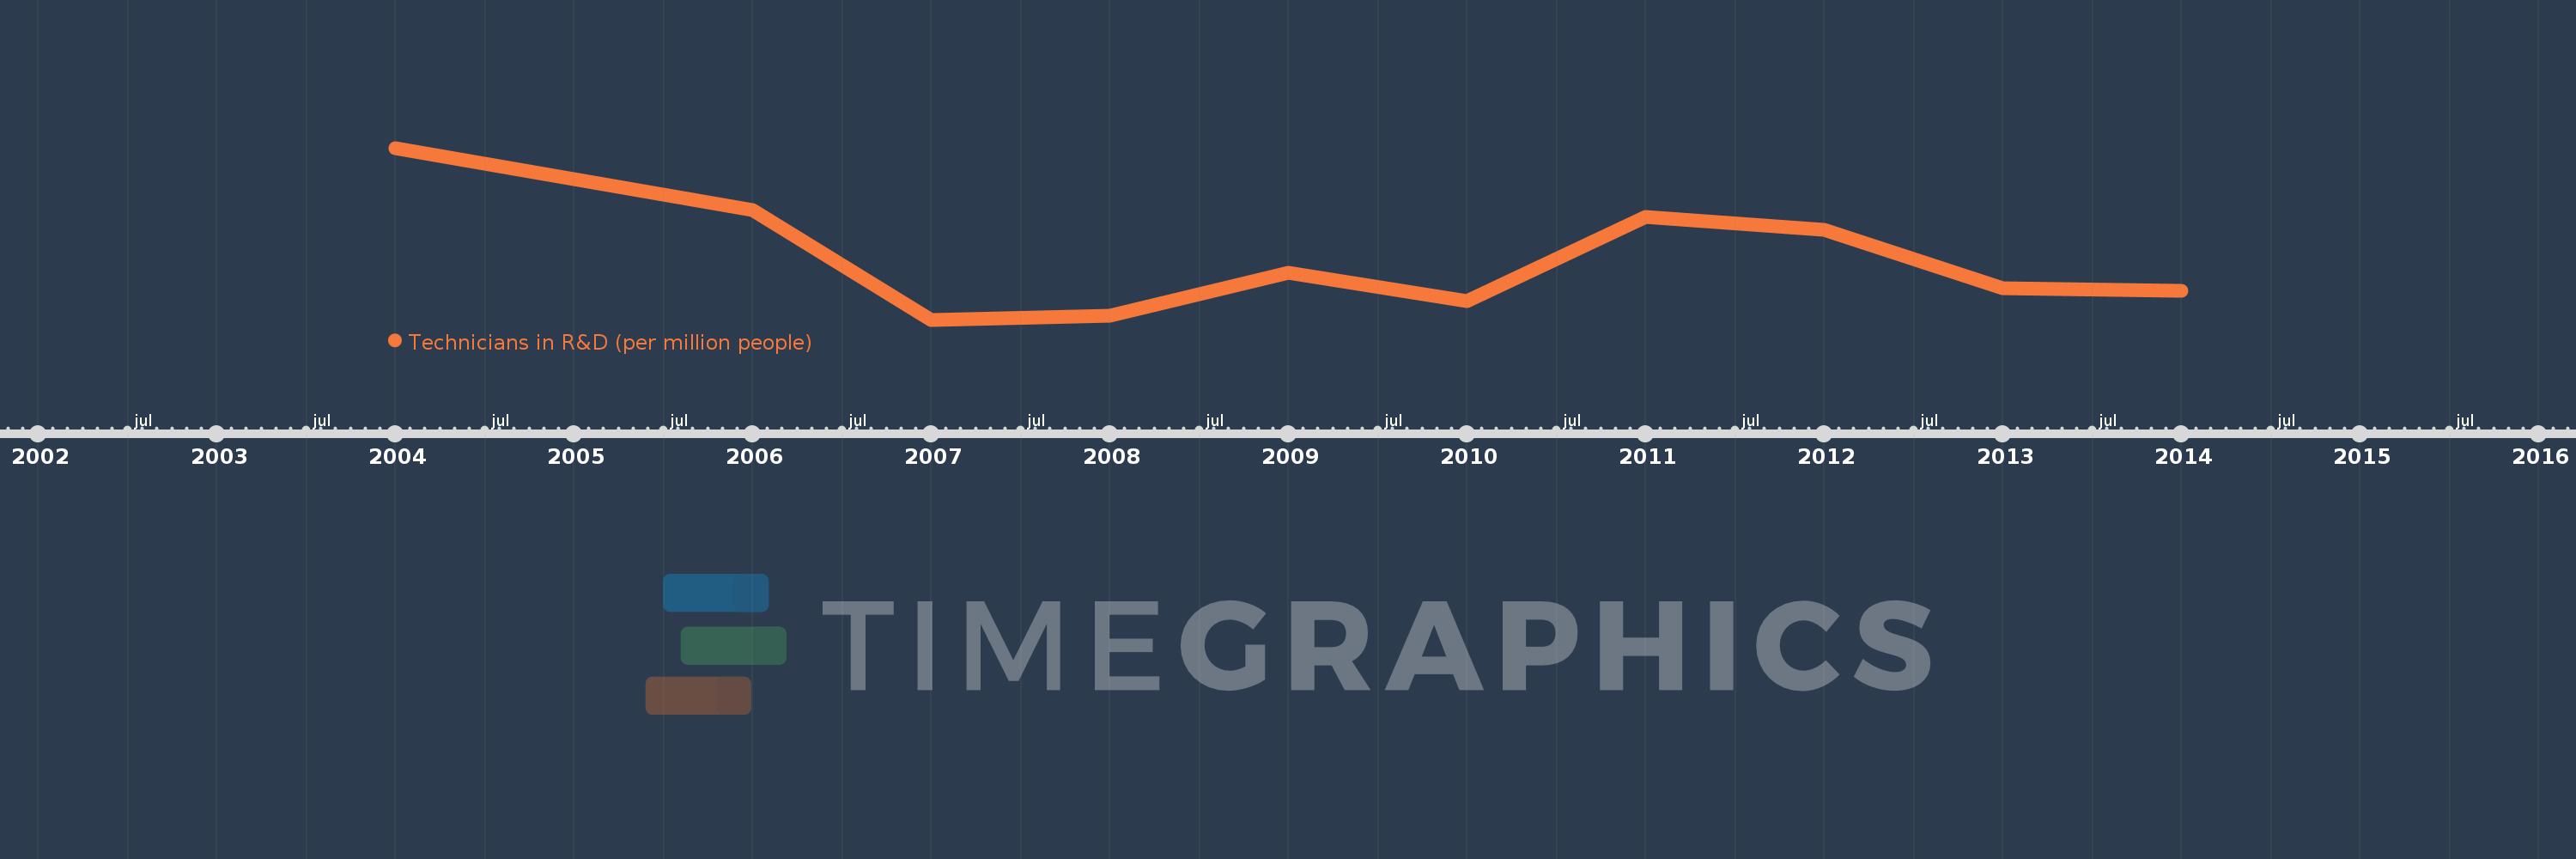
Technicians in R&D (per million people)
2014,2013,2012,2011,2010,2009,2008,2007,2006,2004
This statistics in other country:
Timeline:
This timeline shows a graph from 2004 to 2014 of Luxembourg. No data until 2003. Number of actual observations by date: 10.
Source name:
World Development Indicators
Source organization:
United Nations Educational, Scientific, and Cultural Organization (UNESCO) Institute for Statistics.
Categories, topics:
Science & Technology
Last updated:
apr 23, 2017
Indicators value changes by year
Minimum:
2.759K
jan 1, 2007
Maximum:
3.767K
jan 1, 2004
At the date of observation
Value
Absolute change
Change from previous value
jan 1, 2004
3.767K
+3.767K
0.0%
jan 1, 2006
3.402K
-364.423
-9.67%
jan 1, 2007
2.759K
-643.536
-18.91%
jan 1, 2008
2.783K
+24.291
0.88%
jan 1, 2009
3.037K
+253.623
9.11%
jan 1, 2010
2.868K
-168.553
-5.55%
jan 1, 2011
3.363K
+494.526
17.24%
jan 1, 2012
3.285K
-77.726
-2.31%
jan 1, 2013
2.945K
-339.792
-10.34%
jan 1, 2014
2.929K
-16.589
-0.56%
Ranking of countries by current statistics by years


Comments: