29
/
en
AIzaSyAYiBZKx7MnpbEhh9jyipgxe19OcubqV5w
April 1, 2024
185963
Madagascar
MDG
true
2
1
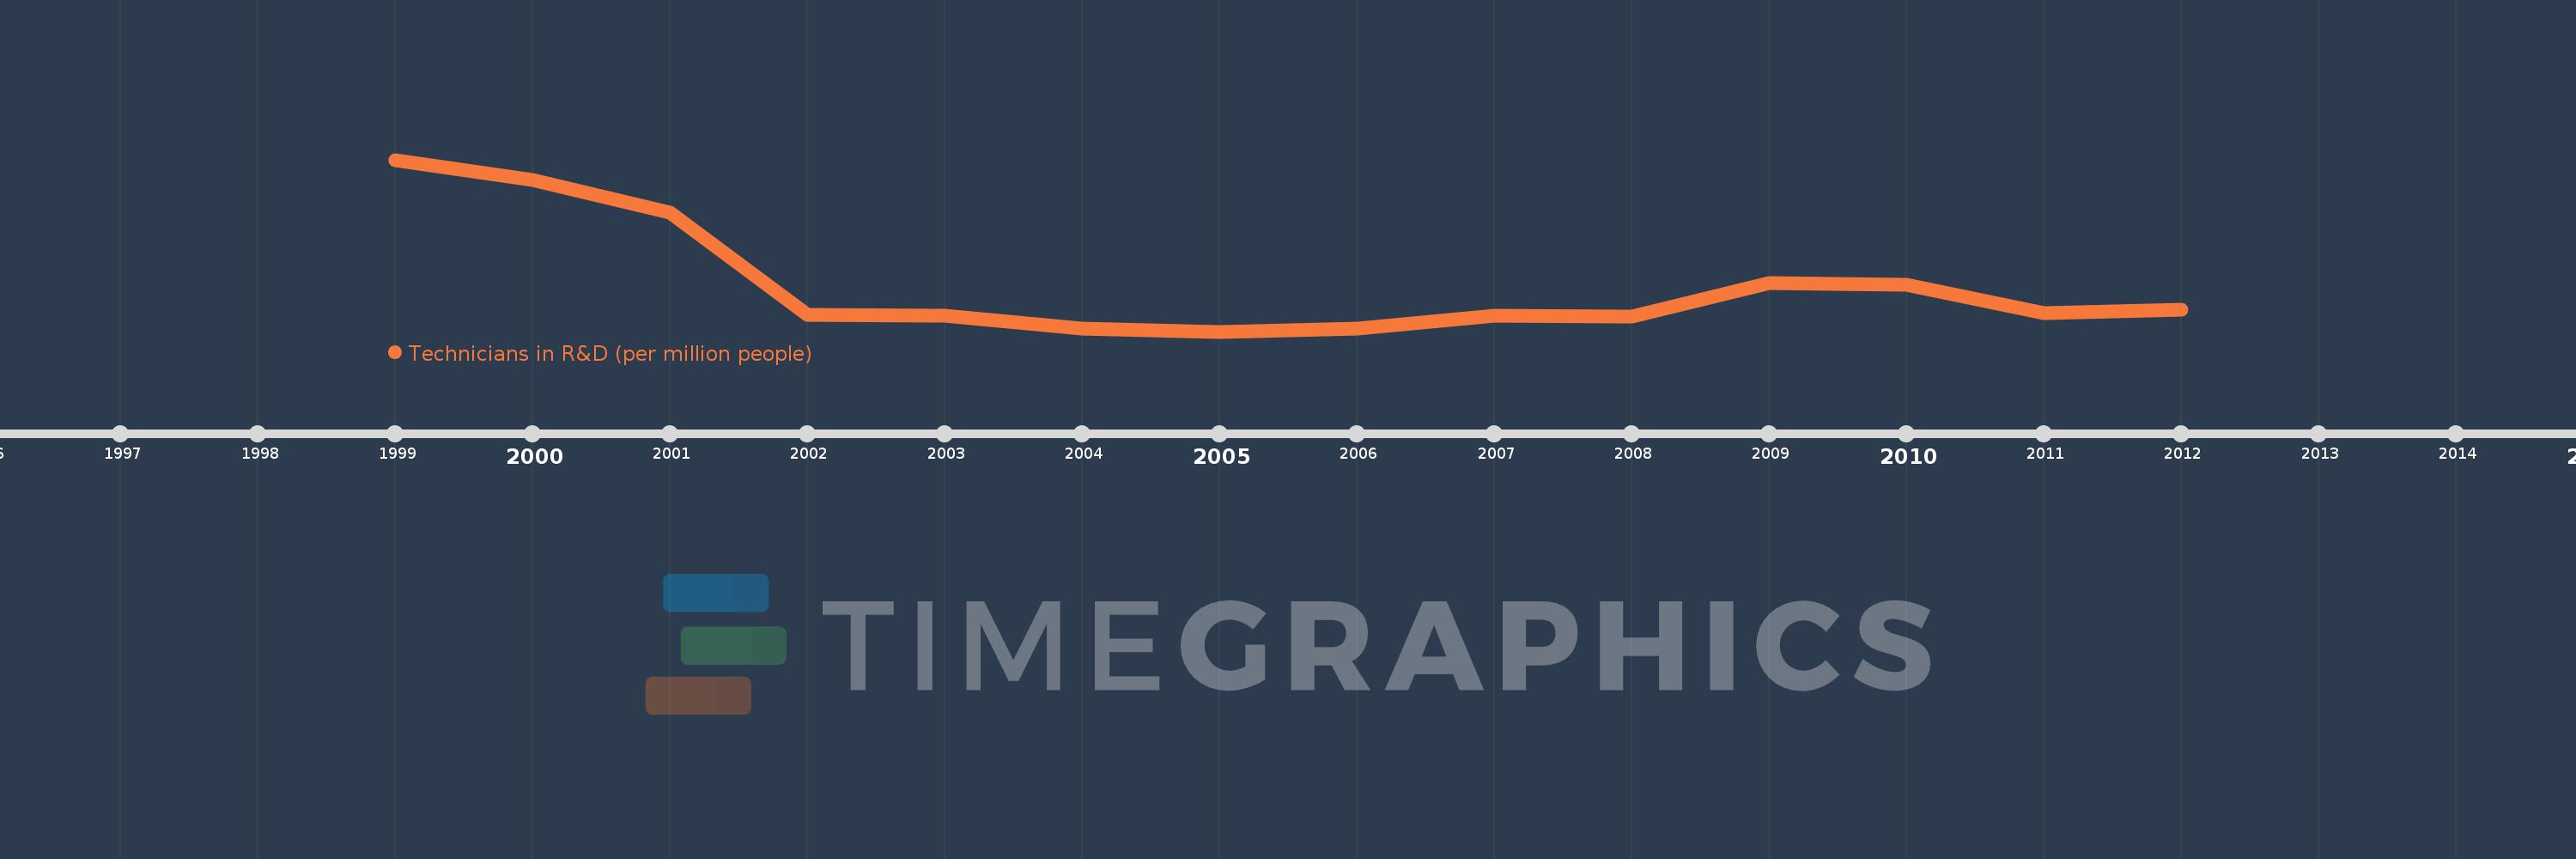
Technicians in R&D (per million people)
2012,2011,2010,2009,2008,2007,2006,2005,2004,2003,2002,2001,2000,1999
This statistics in other country:
Timeline:
This timeline shows a graph from 1999 to 2012 of Madagascar. No data until 1998. Number of actual observations by date: 14.
Source name:
World Development Indicators
Source organization:
United Nations Educational, Scientific, and Cultural Organization (UNESCO) Institute for Statistics.
Categories, topics:
Science & Technology
Last updated:
apr 23, 2017
Indicators value changes by year
Maximum:
62.744
jan 1, 1999
At the date of observation
Value
Absolute change
Change from previous value
jan 1, 1999
62.744
+62.744
0.0%
jan 1, 2000
56.477
-6.267
-9.99%
jan 1, 2001
46.364
-10.113
-17.91%
jan 1, 2002
14.967
-31.398
-67.72%
jan 1, 2003
14.639
-0.328
-2.19%
jan 1, 2004
10.902
-3.738
-25.53%
jan 1, 2005
9.852
-1.05
-9.63%
jan 1, 2006
10.661
+0.81
8.22%
jan 1, 2007
14.767
+4.105
38.51%
jan 1, 2008
14.455
-0.312
-2.11%
jan 1, 2009
24.891
+10.437
72.2%
jan 1, 2010
24.249
-0.642
-2.58%
jan 1, 2011
15.465
-8.784
-36.22%
jan 1, 2012
16.56
+1.095
7.08%
Ranking of countries by current statistics by years


Comments: