29
/
en
AIzaSyAYiBZKx7MnpbEhh9jyipgxe19OcubqV5w
April 1, 2024
42413
Latin America & Caribbean (excluding high income)
LAC
false
2
1
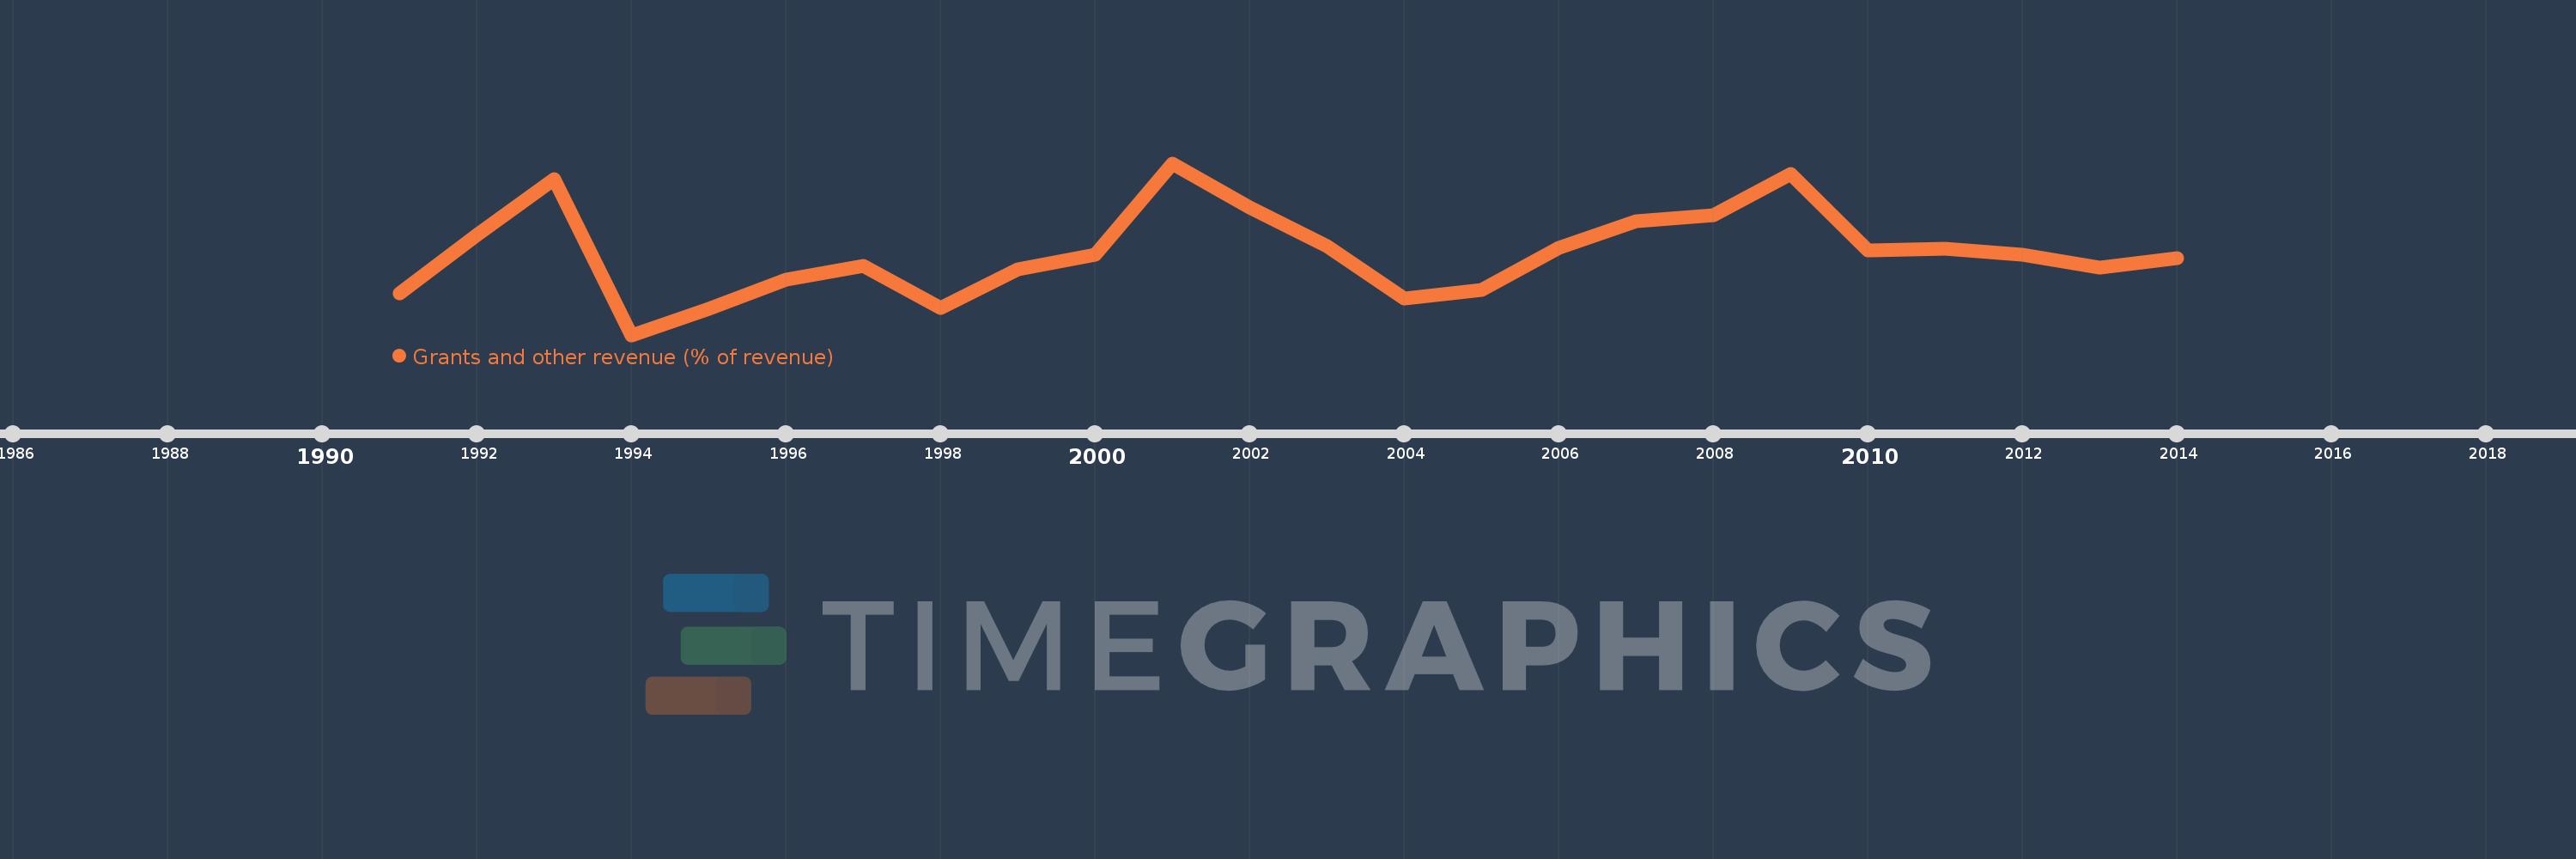
Grants and other revenue (% of revenue)
2014,2013,2012,2011,2010,2009,2008,2007,2006,2005,2004,2003,2002,2001,2000,1999,1998,1997,1996,1995,1994,1993,1992,1991
This statistics in other country:
AfghanistanAlbaniaAlgeriaAngolaAntigua and BarbudaArab WorldArgentinaArmeniaAustraliaAustriaAzerbaijanBahamas, TheBahrainBangladeshBarbadosBelarusBelgiumBelizeBeninBhutanBoliviaBosnia and HerzegovinaBotswanaBrazilBulgariaBurkina FasoBurundiCabo VerdeCambodiaCanadaCaribbean small statesCentral African RepublicCentral Europe and the BalticsChileChinaColombiaCongo, Dem. Rep.Congo, Rep.Costa RicaCote d'IvoireCroatiaCyprusCzech RepublicDenmarkDominicaDominican RepublicEarly-demographic dividendEast Asia & PacificEast Asia & Pacific (excluding high income)East Asia & Pacific (IDA & IBRD countries)Egypt, Arab Rep.El SalvadorEquatorial GuineaEstoniaEthiopiaEuro areaEurope & Central AsiaEurope & Central Asia (excluding high income)Europe & Central Asia (IDA & IBRD countries)European UnionFijiFinlandFranceGambia, TheGeorgiaGermanyGhanaGreeceGrenadaGuatemalaHeavily indebted poor countries (HIPC)High incomeHondurasHong Kong SAR, ChinaHungaryIBRD onlyIcelandIDA & IBRD totalIDA blendIDA onlyIDA totalIndiaIndonesiaIran, Islamic Rep.IraqIrelandIsraelItalyJamaicaJapanJordanKazakhstanKenyaKiribatiKorea, Rep.KuwaitKyrgyz RepublicLao PDRLate-demographic dividendLatin America & Caribbean Latin America & Caribbean (excluding high income)Latin America & the Caribbean (IDA & IBRD countries)LatviaLeast developed countries: UN classificationLebanonLesothoLiberiaLithuaniaLow & middle incomeLow incomeLower middle incomeLuxembourgMacao SAR, ChinaMacedonia, FYRMadagascarMalawiMalaysiaMaldivesMaliMaltaMauritiusMexicoMicronesia, Fed. Sts.Middle East & North AfricaMiddle East & North Africa (excluding high income)Middle East & North Africa (IDA & IBRD countries)Middle incomeMoldovaMongoliaMoroccoMozambiqueMyanmarNamibiaNepalNetherlandsNew ZealandNicaraguaNigeriaNorth AmericaNorwayOECD membersOmanOther small statesPakistanPanamaPapua New GuineaParaguayPeruPhilippinesPolandPortugalPost-demographic dividendPre-demographic dividendQatarRomaniaRussian FederationRwandaSamoaSan MarinoSao Tome and PrincipeSenegalSerbiaSeychellesSierra LeoneSingaporeSlovak RepublicSloveniaSmall statesSolomon IslandsSouth AfricaSouth AsiaSouth Asia (IDA & IBRD)SpainSri LankaSt. Kitts and NevisSt. LuciaSt. Vincent and the GrenadinesSub-Saharan Africa Sub-Saharan Africa (excluding high income)Sub-Saharan Africa (IDA & IBRD countries)SurinameSwazilandSwedenSwitzerlandSyrian Arab RepublicTajikistanTanzaniaThailandTimor-LesteTogoTrinidad and TobagoTunisiaTurkeyUgandaUkraineUnited Arab EmiratesUnited KingdomUnited StatesUpper middle incomeUruguayVanuatuVenezuela, RBVietnamWest Bank and GazaWorldYemen, Rep.ZambiaZimbabwe Timeline:
This timeline shows a graph from 1991 to 2014 of Latin America & Caribbean (excluding high income). No data until 1990. Number of actual observations by date: 24.
Source name:
World Development Indicators
Source organization:
International Monetary Fund, Government Finance Statistics Yearbook and data files.
Categories, topics:
Public Sector
Last updated:
apr 23, 2017
Indicators value changes by year
Minimum:
11.515
jan 1, 1994
Maximum:
20.204
jan 1, 2001
At the date of observation
Value
Absolute change
Change from previous value
jan 1, 1991
13.637
+13.637
0.0%
jan 1, 1992
16.598
+2.961
21.71%
jan 1, 1993
19.412
+2.813
16.95%
jan 1, 1994
11.515
-7.896
-40.68%
jan 1, 1995
12.859
+1.344
11.67%
jan 1, 1996
14.322
+1.462
11.37%
jan 1, 1997
15.009
+0.687
4.8%
jan 1, 1998
12.876
-2.133
-14.21%
jan 1, 1999
14.848
+1.972
15.31%
jan 1, 2000
15.574
+0.726
4.89%
jan 1, 2001
20.204
+4.63
29.73%
jan 1, 2002
17.984
-2.22
-10.99%
jan 1, 2003
16.022
-1.962
-10.91%
jan 1, 2004
13.354
-2.668
-16.65%
jan 1, 2005
13.802
+0.448
3.36%
jan 1, 2006
15.917
+2.115
15.33%
jan 1, 2007
17.272
+1.355
8.51%
jan 1, 2008
17.568
+0.297
1.72%
jan 1, 2009
19.642
+2.074
11.8%
jan 1, 2010
15.784
-3.858
-19.64%
jan 1, 2011
15.861
+0.077
0.49%
jan 1, 2012
15.575
-0.286
-1.8%
jan 1, 2013
14.918
-0.657
-4.22%
jan 1, 2014
15.382
+0.464
3.11%
Ranking of countries by current statistics by years


Comments: