29
/
en
AIzaSyAYiBZKx7MnpbEhh9jyipgxe19OcubqV5w
April 1, 2024
154640
India
IND
true
2
1
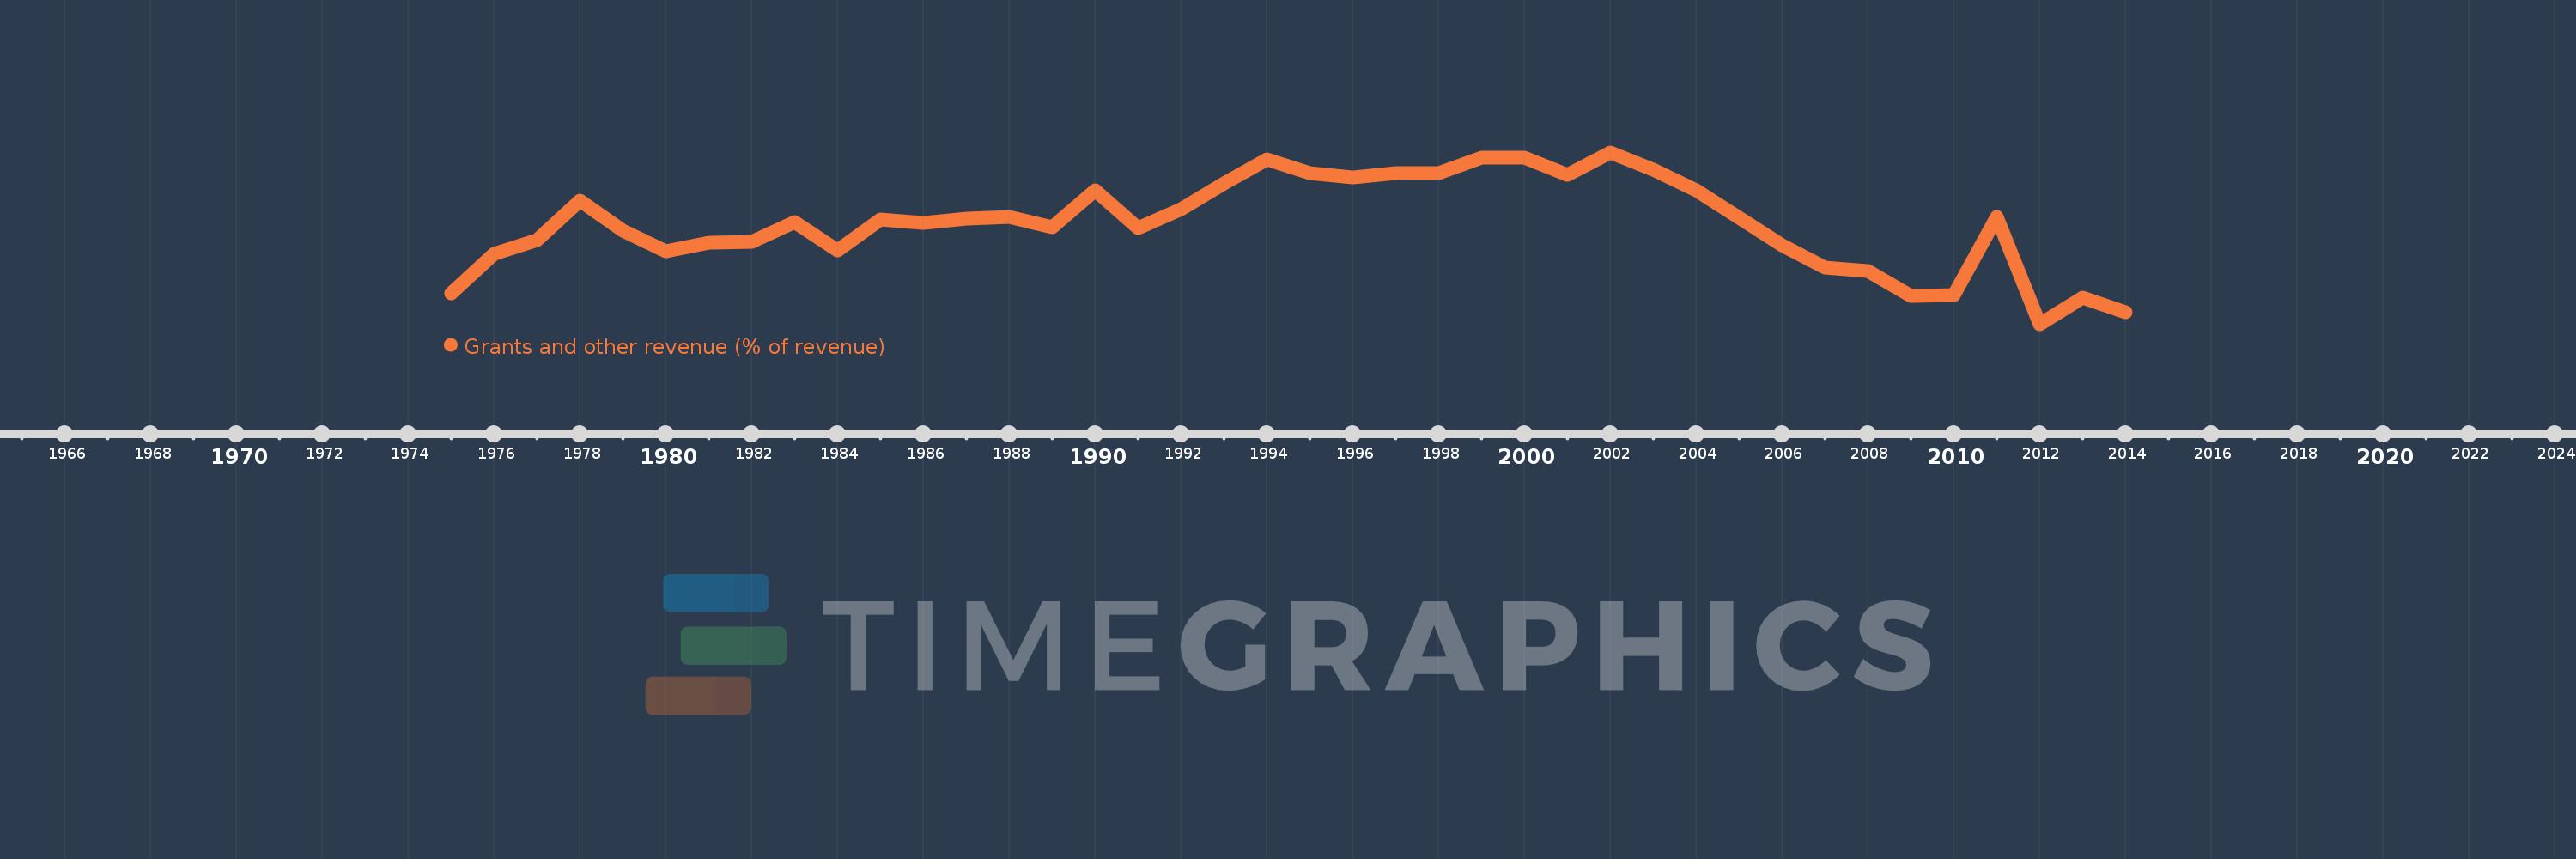
Grants and other revenue (% of revenue)
2014,2013,2012,2011,2010,2009,2008,2007,2006,2005,2004,2003,2002,2001,2000,1999,1998,1997,1996,1995,1994,1993,1992,1991,1990,1989,1988,1987,1986,1985,1984,1983,1982,1981,1980,1979,1978,1977,1976,1975
This statistics in other country:
AfghanistanAlbaniaAlgeriaAngolaAntigua and BarbudaArab WorldArgentinaArmeniaAustraliaAustriaAzerbaijanBahamas, TheBahrainBangladeshBarbadosBelarusBelgiumBelizeBeninBhutanBoliviaBosnia and HerzegovinaBotswanaBrazilBulgariaBurkina FasoBurundiCabo VerdeCambodiaCanadaCaribbean small statesCentral African RepublicCentral Europe and the BalticsChileChinaColombiaCongo, Dem. Rep.Congo, Rep.Costa RicaCote d'IvoireCroatiaCyprusCzech RepublicDenmarkDominicaDominican RepublicEarly-demographic dividendEast Asia & PacificEast Asia & Pacific (excluding high income)East Asia & Pacific (IDA & IBRD countries)Egypt, Arab Rep.El SalvadorEquatorial GuineaEstoniaEthiopiaEuro areaEurope & Central AsiaEurope & Central Asia (excluding high income)Europe & Central Asia (IDA & IBRD countries)European UnionFijiFinlandFranceGambia, TheGeorgiaGermanyGhanaGreeceGrenadaGuatemalaHeavily indebted poor countries (HIPC)High incomeHondurasHong Kong SAR, ChinaHungaryIBRD onlyIcelandIDA & IBRD totalIDA blendIDA onlyIDA totalIndiaIndonesiaIran, Islamic Rep.IraqIrelandIsraelItalyJamaicaJapanJordanKazakhstanKenyaKiribatiKorea, Rep.KuwaitKyrgyz RepublicLao PDRLate-demographic dividendLatin America & Caribbean Latin America & Caribbean (excluding high income)Latin America & the Caribbean (IDA & IBRD countries)LatviaLeast developed countries: UN classificationLebanonLesothoLiberiaLithuaniaLow & middle incomeLow incomeLower middle incomeLuxembourgMacao SAR, ChinaMacedonia, FYRMadagascarMalawiMalaysiaMaldivesMaliMaltaMauritiusMexicoMicronesia, Fed. Sts.Middle East & North AfricaMiddle East & North Africa (excluding high income)Middle East & North Africa (IDA & IBRD countries)Middle incomeMoldovaMongoliaMoroccoMozambiqueMyanmarNamibiaNepalNetherlandsNew ZealandNicaraguaNigeriaNorth AmericaNorwayOECD membersOmanOther small statesPakistanPanamaPapua New GuineaParaguayPeruPhilippinesPolandPortugalPost-demographic dividendPre-demographic dividendQatarRomaniaRussian FederationRwandaSamoaSan MarinoSao Tome and PrincipeSenegalSerbiaSeychellesSierra LeoneSingaporeSlovak RepublicSloveniaSmall statesSolomon IslandsSouth AfricaSouth AsiaSouth Asia (IDA & IBRD)SpainSri LankaSt. Kitts and NevisSt. LuciaSt. Vincent and the GrenadinesSub-Saharan Africa Sub-Saharan Africa (excluding high income)Sub-Saharan Africa (IDA & IBRD countries)SurinameSwazilandSwedenSwitzerlandSyrian Arab RepublicTajikistanTanzaniaThailandTimor-LesteTogoTrinidad and TobagoTunisiaTurkeyUgandaUkraineUnited Arab EmiratesUnited KingdomUnited StatesUpper middle incomeUruguayVanuatuVenezuela, RBVietnamWest Bank and GazaWorldYemen, Rep.ZambiaZimbabwe Timeline:
This timeline shows a graph from 1975 to 2014 of India. No data until 1974. Number of actual observations by date: 40.
Source name:
World Development Indicators
Source organization:
International Monetary Fund, Government Finance Statistics Yearbook and data files.
Categories, topics:
Public Sector
Last updated:
apr 23, 2017
Indicators value changes by year
Minimum:
11.582
jan 1, 2012
At the date of observation
Value
Absolute change
Change from previous value
jan 1, 1975
14.361
+14.361
0.0%
jan 1, 1976
17.877
+3.516
24.48%
jan 1, 1977
19.106
+1.229
6.87%
jan 1, 1978
22.618
+3.513
18.39%
jan 1, 1979
19.907
-2.712
-11.99%
jan 1, 1980
18.123
-1.783
-8.96%
jan 1, 1981
18.848
+0.725
4.0%
jan 1, 1982
18.917
+0.069
0.37%
jan 1, 1983
20.711
+1.794
9.48%
jan 1, 1984
18.147
-2.564
-12.38%
jan 1, 1985
20.971
+2.824
15.56%
jan 1, 1986
20.651
-0.32
-1.53%
jan 1, 1987
20.975
+0.324
1.57%
jan 1, 1988
21.17
+0.196
0.93%
jan 1, 1989
20.257
-0.914
-4.32%
jan 1, 1990
23.569
+3.313
16.35%
jan 1, 1991
20.142
-3.428
-14.54%
jan 1, 1992
21.869
+1.727
8.57%
jan 1, 1993
24.177
+2.308
10.55%
jan 1, 1994
26.3
+2.123
8.78%
jan 1, 1995
25.075
-1.224
-4.66%
jan 1, 1996
24.699
-0.376
-1.5%
jan 1, 1997
25.062
+0.363
1.47%
jan 1, 1998
25.045
-0.018
-0.07%
jan 1, 1999
26.481
+1.437
5.74%
jan 1, 2000
26.477
-0.005
-0.02%
jan 1, 2001
24.915
-1.561
-5.9%
jan 1, 2002
26.93
+2.015
8.09%
jan 1, 2003
25.413
-1.518
-5.64%
jan 1, 2004
23.516
-1.897
-7.46%
jan 1, 2005
21.078
-2.438
-10.37%
jan 1, 2006
18.64
-2.438
-11.57%
jan 1, 2007
16.653
-1.987
-10.66%
jan 1, 2008
16.357
-0.297
-1.78%
jan 1, 2009
14.081
-2.276
-13.91%
jan 1, 2010
14.183
+0.102
0.72%
jan 1, 2011
21.158
+6.976
49.18%
jan 1, 2012
11.582
-9.577
-45.26%
jan 1, 2013
13.95
+2.368
20.45%
jan 1, 2014
12.647
-1.302
-9.34%
Ranking of countries by current statistics by years


Comments: