29
/
en
AIzaSyAYiBZKx7MnpbEhh9jyipgxe19OcubqV5w
April 1, 2024
262284
Thailand
THA
true
2
1
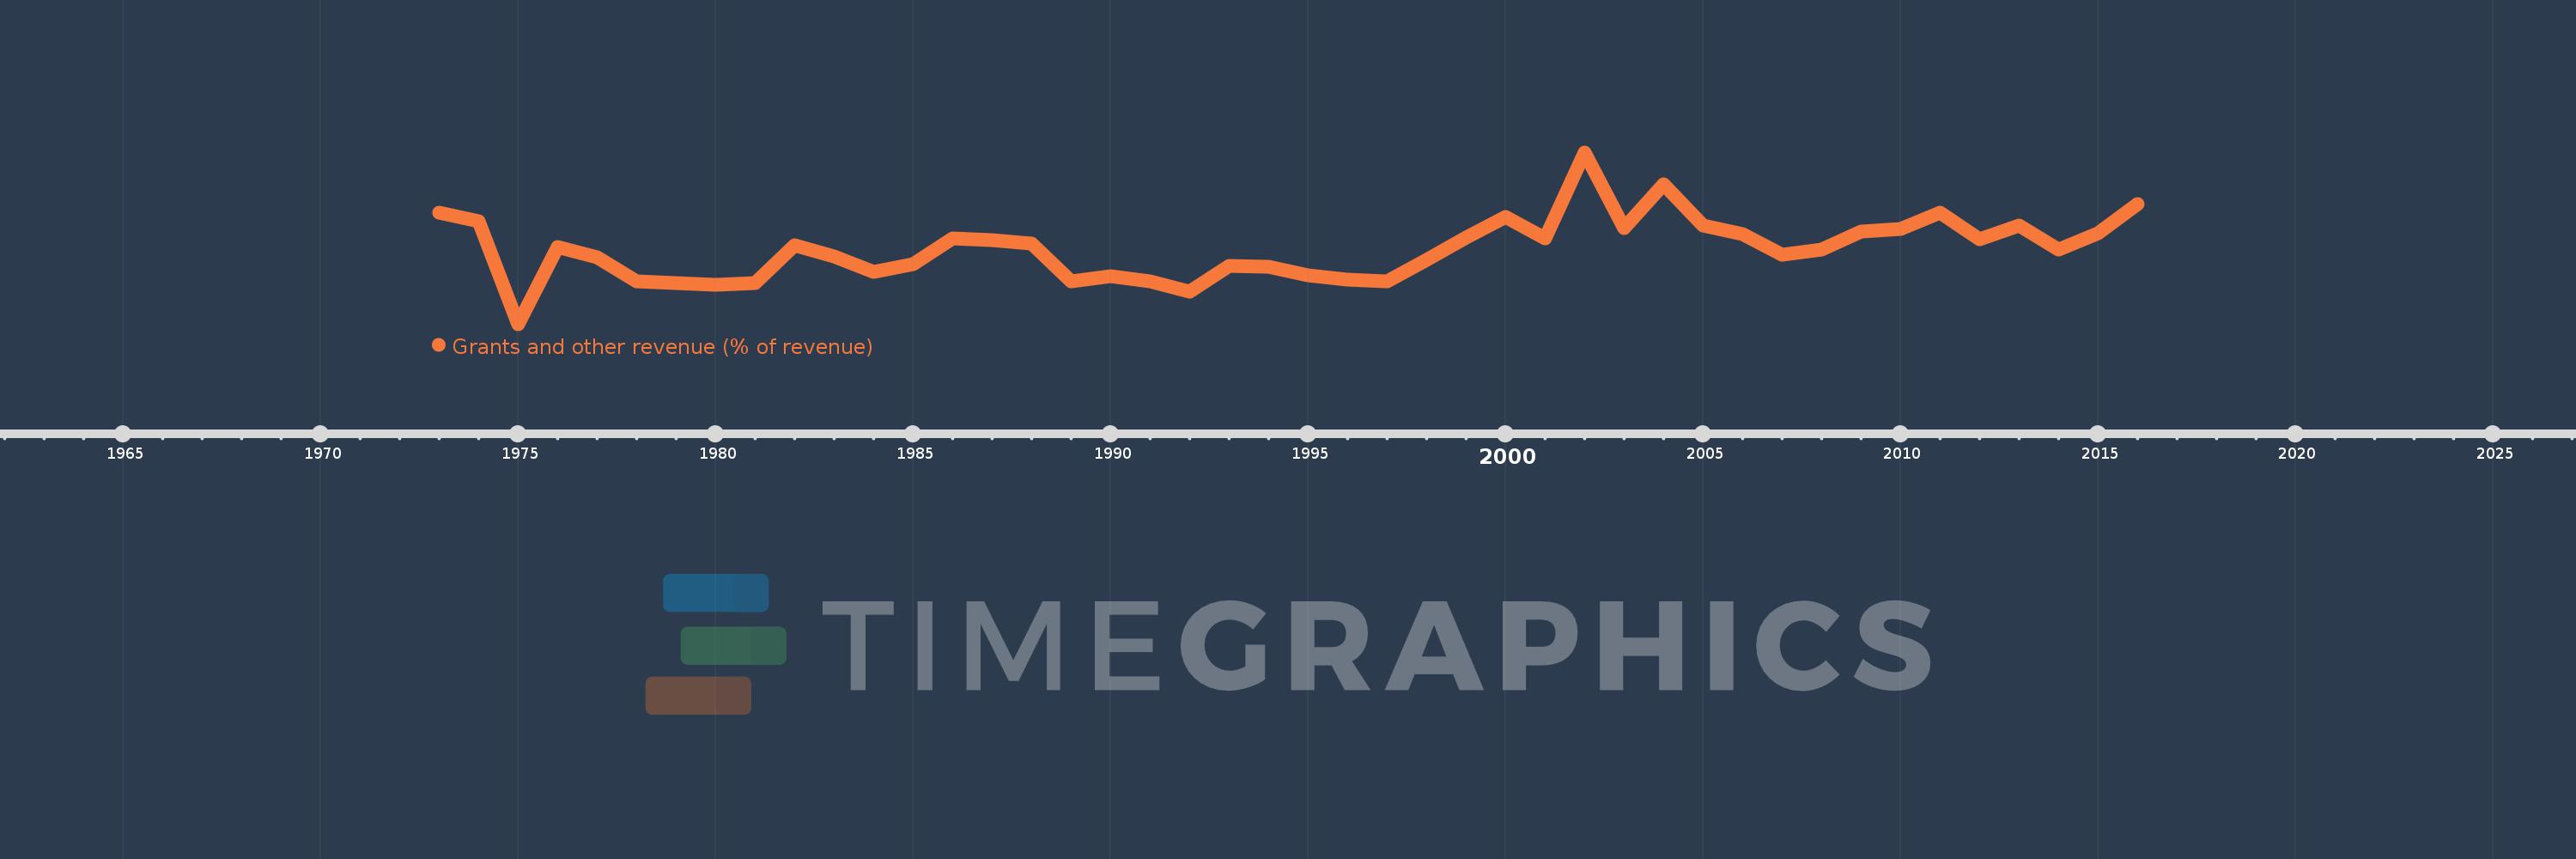
Grants and other revenue (% of revenue)
2016,2015,2014,2013,2012,2011,2010,2009,2008,2007,2006,2005,2004,2003,2002,2001,2000,1999,1998,1997,1996,1995,1994,1993,1992,1991,1990,1989,1988,1987,1986,1985,1984,1983,1982,1981,1980,1979,1978,1977,1976,1975,1974,1973
This statistics in other country:
AfghanistanAlbaniaAlgeriaAngolaAntigua and BarbudaArab WorldArgentinaArmeniaAustraliaAustriaAzerbaijanBahamas, TheBahrainBangladeshBarbadosBelarusBelgiumBelizeBeninBhutanBoliviaBosnia and HerzegovinaBotswanaBrazilBulgariaBurkina FasoBurundiCabo VerdeCambodiaCanadaCaribbean small statesCentral African RepublicCentral Europe and the BalticsChileChinaColombiaCongo, Dem. Rep.Congo, Rep.Costa RicaCote d'IvoireCroatiaCyprusCzech RepublicDenmarkDominicaDominican RepublicEarly-demographic dividendEast Asia & PacificEast Asia & Pacific (excluding high income)East Asia & Pacific (IDA & IBRD countries)Egypt, Arab Rep.El SalvadorEquatorial GuineaEstoniaEthiopiaEuro areaEurope & Central AsiaEurope & Central Asia (excluding high income)Europe & Central Asia (IDA & IBRD countries)European UnionFijiFinlandFranceGambia, TheGeorgiaGermanyGhanaGreeceGrenadaGuatemalaHeavily indebted poor countries (HIPC)High incomeHondurasHong Kong SAR, ChinaHungaryIBRD onlyIcelandIDA & IBRD totalIDA blendIDA onlyIDA totalIndiaIndonesiaIran, Islamic Rep.IraqIrelandIsraelItalyJamaicaJapanJordanKazakhstanKenyaKiribatiKorea, Rep.KuwaitKyrgyz RepublicLao PDRLate-demographic dividendLatin America & Caribbean Latin America & Caribbean (excluding high income)Latin America & the Caribbean (IDA & IBRD countries)LatviaLeast developed countries: UN classificationLebanonLesothoLiberiaLithuaniaLow & middle incomeLow incomeLower middle incomeLuxembourgMacao SAR, ChinaMacedonia, FYRMadagascarMalawiMalaysiaMaldivesMaliMaltaMauritiusMexicoMicronesia, Fed. Sts.Middle East & North AfricaMiddle East & North Africa (excluding high income)Middle East & North Africa (IDA & IBRD countries)Middle incomeMoldovaMongoliaMoroccoMozambiqueMyanmarNamibiaNepalNetherlandsNew ZealandNicaraguaNigeriaNorth AmericaNorwayOECD membersOmanOther small statesPakistanPanamaPapua New GuineaParaguayPeruPhilippinesPolandPortugalPost-demographic dividendPre-demographic dividendQatarRomaniaRussian FederationRwandaSamoaSan MarinoSao Tome and PrincipeSenegalSerbiaSeychellesSierra LeoneSingaporeSlovak RepublicSloveniaSmall statesSolomon IslandsSouth AfricaSouth AsiaSouth Asia (IDA & IBRD)SpainSri LankaSt. Kitts and NevisSt. LuciaSt. Vincent and the GrenadinesSub-Saharan Africa Sub-Saharan Africa (excluding high income)Sub-Saharan Africa (IDA & IBRD countries)SurinameSwazilandSwedenSwitzerlandSyrian Arab RepublicTajikistanTanzaniaThailandTimor-LesteTogoTrinidad and TobagoTunisiaTurkeyUgandaUkraineUnited Arab EmiratesUnited KingdomUnited StatesUpper middle incomeUruguayVanuatuVenezuela, RBVietnamWest Bank and GazaWorldYemen, Rep.ZambiaZimbabwe Timeline:
This timeline shows a graph from 1973 to 2016 of Thailand. No data until 1972. Number of actual observations by date: 44.
Source name:
World Development Indicators
Source organization:
International Monetary Fund, Government Finance Statistics Yearbook and data files.
Categories, topics:
Public Sector
Last updated:
apr 23, 2017
Indicators value changes by year
Maximum:
19.393
jan 1, 2002
At the date of observation
Value
Absolute change
Change from previous value
jan 1, 1973
15.01
+15.01
0.0%
jan 1, 1974
14.41
-0.601
-4.0%
jan 1, 1975
6.97
-7.44
-51.63%
jan 1, 1976
12.572
+5.602
80.38%
jan 1, 1977
11.818
-0.754
-5.99%
jan 1, 1978
10.086
-1.732
-14.65%
jan 1, 1979
9.922
-0.164
-1.63%
jan 1, 1980
9.817
-0.105
-1.06%
jan 1, 1981
9.973
+0.155
1.58%
jan 1, 1982
12.66
+2.688
26.95%
jan 1, 1983
11.852
-0.808
-6.38%
jan 1, 1984
10.752
-1.1
-9.28%
jan 1, 1985
11.299
+0.547
5.08%
jan 1, 1986
13.16
+1.861
16.47%
jan 1, 1987
13.042
-0.118
-0.9%
jan 1, 1988
12.818
-0.224
-1.71%
jan 1, 1989
10.096
-2.722
-21.24%
jan 1, 1990
10.421
+0.325
3.22%
jan 1, 1991
10.098
-0.323
-3.1%
jan 1, 1992
9.295
-0.803
-7.95%
jan 1, 1993
11.176
+1.881
20.23%
jan 1, 1994
11.145
-0.031
-0.28%
jan 1, 1995
10.477
-0.668
-5.99%
jan 1, 1996
10.195
-0.283
-2.7%
jan 1, 1997
10.065
-0.13
-1.28%
jan 1, 1998
11.633
+1.568
15.58%
jan 1, 1999
13.215
+1.582
13.6%
jan 1, 2000
14.752
+1.537
11.63%
jan 1, 2001
13.164
-1.588
-10.77%
jan 1, 2002
19.393
+6.229
47.32%
jan 1, 2003
13.891
-5.502
-28.37%
jan 1, 2004
17.109
+3.218
23.17%
jan 1, 2005
14.132
-2.977
-17.4%
jan 1, 2006
13.502
-0.63
-4.46%
jan 1, 2007
11.974
-1.527
-11.31%
jan 1, 2008
12.363
+0.388
3.24%
jan 1, 2009
13.698
+1.335
10.8%
jan 1, 2010
13.835
+0.138
1.0%
jan 1, 2011
15.038
+1.203
8.69%
jan 1, 2012
13.133
-1.905
-12.67%
jan 1, 2013
14.116
+0.984
7.49%
jan 1, 2014
12.376
-1.74
-12.33%
jan 1, 2015
13.571
+1.195
9.66%
jan 1, 2016
15.664
+2.093
15.42%
Ranking of countries by current statistics by years


Comments: