29
/
en
AIzaSyAYiBZKx7MnpbEhh9jyipgxe19OcubqV5w
April 1, 2024
247586
Spain
ESP
true
2
1
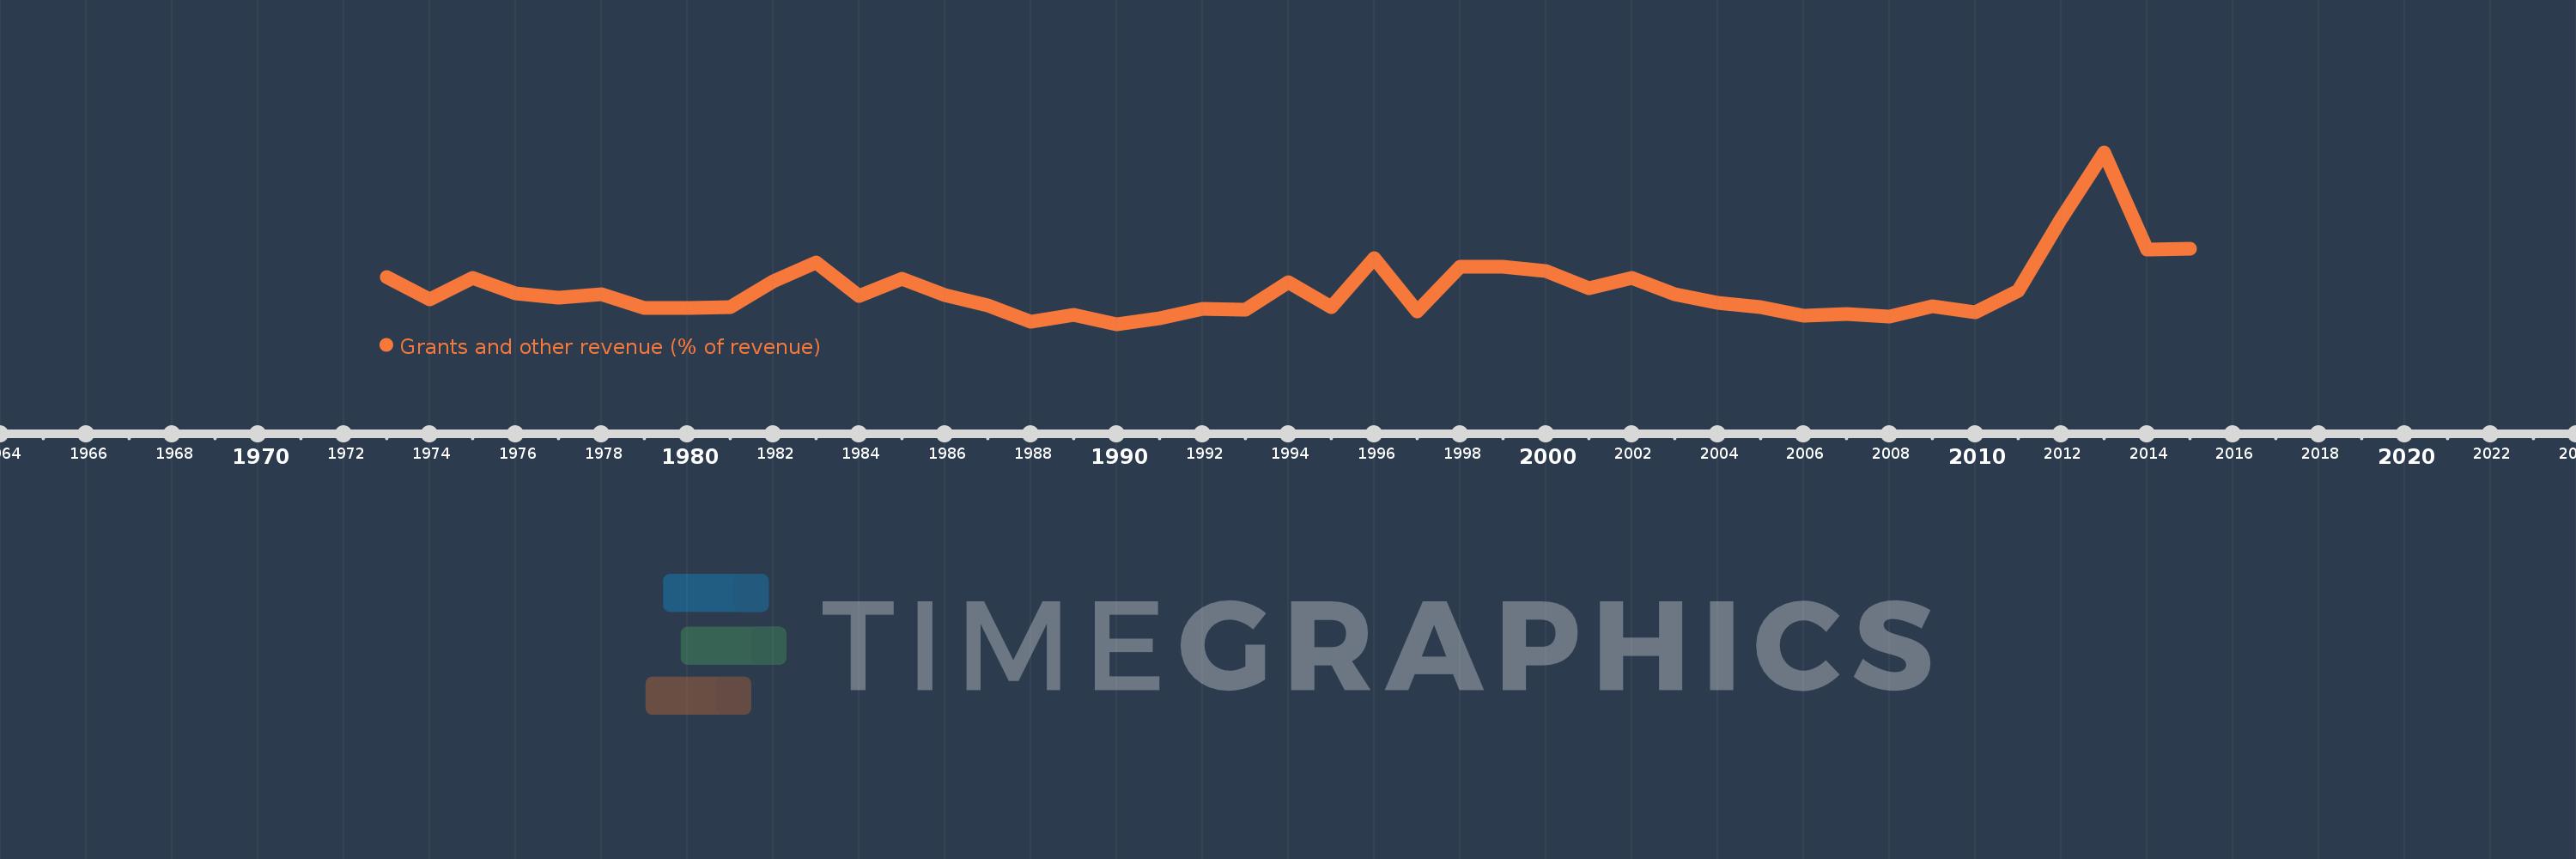
Grants and other revenue (% of revenue)
2015,2014,2013,2012,2011,2010,2009,2008,2007,2006,2005,2004,2003,2002,2001,2000,1999,1998,1997,1996,1995,1994,1993,1992,1991,1990,1989,1988,1987,1986,1985,1984,1983,1982,1981,1980,1979,1978,1977,1976,1975,1974,1973
This statistics in other country:
AfghanistanAlbaniaAlgeriaAngolaAntigua and BarbudaArab WorldArgentinaArmeniaAustraliaAustriaAzerbaijanBahamas, TheBahrainBangladeshBarbadosBelarusBelgiumBelizeBeninBhutanBoliviaBosnia and HerzegovinaBotswanaBrazilBulgariaBurkina FasoBurundiCabo VerdeCambodiaCanadaCaribbean small statesCentral African RepublicCentral Europe and the BalticsChileChinaColombiaCongo, Dem. Rep.Congo, Rep.Costa RicaCote d'IvoireCroatiaCyprusCzech RepublicDenmarkDominicaDominican RepublicEarly-demographic dividendEast Asia & PacificEast Asia & Pacific (excluding high income)East Asia & Pacific (IDA & IBRD countries)Egypt, Arab Rep.El SalvadorEquatorial GuineaEstoniaEthiopiaEuro areaEurope & Central AsiaEurope & Central Asia (excluding high income)Europe & Central Asia (IDA & IBRD countries)European UnionFijiFinlandFranceGambia, TheGeorgiaGermanyGhanaGreeceGrenadaGuatemalaHeavily indebted poor countries (HIPC)High incomeHondurasHong Kong SAR, ChinaHungaryIBRD onlyIcelandIDA & IBRD totalIDA blendIDA onlyIDA totalIndiaIndonesiaIran, Islamic Rep.IraqIrelandIsraelItalyJamaicaJapanJordanKazakhstanKenyaKiribatiKorea, Rep.KuwaitKyrgyz RepublicLao PDRLate-demographic dividendLatin America & Caribbean Latin America & Caribbean (excluding high income)Latin America & the Caribbean (IDA & IBRD countries)LatviaLeast developed countries: UN classificationLebanonLesothoLiberiaLithuaniaLow & middle incomeLow incomeLower middle incomeLuxembourgMacao SAR, ChinaMacedonia, FYRMadagascarMalawiMalaysiaMaldivesMaliMaltaMauritiusMexicoMicronesia, Fed. Sts.Middle East & North AfricaMiddle East & North Africa (excluding high income)Middle East & North Africa (IDA & IBRD countries)Middle incomeMoldovaMongoliaMoroccoMozambiqueMyanmarNamibiaNepalNetherlandsNew ZealandNicaraguaNigeriaNorth AmericaNorwayOECD membersOmanOther small statesPakistanPanamaPapua New GuineaParaguayPeruPhilippinesPolandPortugalPost-demographic dividendPre-demographic dividendQatarRomaniaRussian FederationRwandaSamoaSan MarinoSao Tome and PrincipeSenegalSerbiaSeychellesSierra LeoneSingaporeSlovak RepublicSloveniaSmall statesSolomon IslandsSouth AfricaSouth AsiaSouth Asia (IDA & IBRD)SpainSri LankaSt. Kitts and NevisSt. LuciaSt. Vincent and the GrenadinesSub-Saharan Africa Sub-Saharan Africa (excluding high income)Sub-Saharan Africa (IDA & IBRD countries)SurinameSwazilandSwedenSwitzerlandSyrian Arab RepublicTajikistanTanzaniaThailandTimor-LesteTogoTrinidad and TobagoTunisiaTurkeyUgandaUkraineUnited Arab EmiratesUnited KingdomUnited StatesUpper middle incomeUruguayVanuatuVenezuela, RBVietnamWest Bank and GazaWorldYemen, Rep.ZambiaZimbabwe Timeline:
This timeline shows a graph from 1973 to 2015 of Spain. No data until 1972. Number of actual observations by date: 43.
Source name:
World Development Indicators
Source organization:
International Monetary Fund, Government Finance Statistics Yearbook and data files.
Categories, topics:
Public Sector
Last updated:
apr 23, 2017
Indicators value changes by year
At the date of observation
Value
Absolute change
Change from previous value
jan 1, 1973
11.352
+11.352
0.0%
jan 1, 1974
8.973
-2.379
-20.95%
jan 1, 1975
11.232
+2.259
25.17%
jan 1, 1976
9.6
-1.632
-14.53%
jan 1, 1977
9.184
-0.416
-4.33%
jan 1, 1978
9.551
+0.367
4.0%
jan 1, 1979
8.086
-1.465
-15.34%
jan 1, 1980
8.038
-0.049
-0.6%
jan 1, 1981
8.16
+0.122
1.52%
jan 1, 1982
10.847
+2.688
32.94%
jan 1, 1983
12.903
+2.055
18.94%
jan 1, 1984
9.357
-3.546
-27.48%
jan 1, 1985
11.155
+1.798
19.22%
jan 1, 1986
9.466
-1.688
-15.14%
jan 1, 1987
8.338
-1.128
-11.92%
jan 1, 1988
6.564
-1.774
-21.27%
jan 1, 1989
7.315
+0.751
11.44%
jan 1, 1990
6.317
-0.998
-13.65%
jan 1, 1991
6.993
+0.676
10.7%
jan 1, 1992
7.99
+0.996
14.25%
jan 1, 1993
7.864
-0.126
-1.57%
jan 1, 1994
10.801
+2.937
37.35%
jan 1, 1995
8.158
-2.643
-24.47%
jan 1, 1996
13.353
+5.195
63.68%
jan 1, 1997
7.677
-5.676
-42.5%
jan 1, 1998
12.468
+4.79
62.39%
jan 1, 1999
12.449
-0.018
-0.15%
jan 1, 2000
11.971
-0.478
-3.84%
jan 1, 2001
10.197
-1.774
-14.82%
jan 1, 2002
11.253
+1.057
10.36%
jan 1, 2003
9.491
-1.762
-15.66%
jan 1, 2004
8.626
-0.866
-9.12%
jan 1, 2005
8.175
-0.45
-5.22%
jan 1, 2006
7.201
-0.974
-11.92%
jan 1, 2007
7.451
+0.25
3.47%
jan 1, 2008
7.142
-0.31
-4.16%
jan 1, 2009
8.24
+1.099
15.38%
jan 1, 2010
7.552
-0.688
-8.35%
jan 1, 2011
9.859
+2.307
30.55%
jan 1, 2012
17.606
+7.747
78.57%
jan 1, 2013
24.65
+7.043
40.01%
jan 1, 2014
14.285
-10.364
-42.05%
jan 1, 2015
14.339
+0.054
0.38%
Ranking of countries by current statistics by years


Comments: