29
/
en
AIzaSyAYiBZKx7MnpbEhh9jyipgxe19OcubqV5w
April 1, 2024
185216
Madagascar
MDG
true
2
1
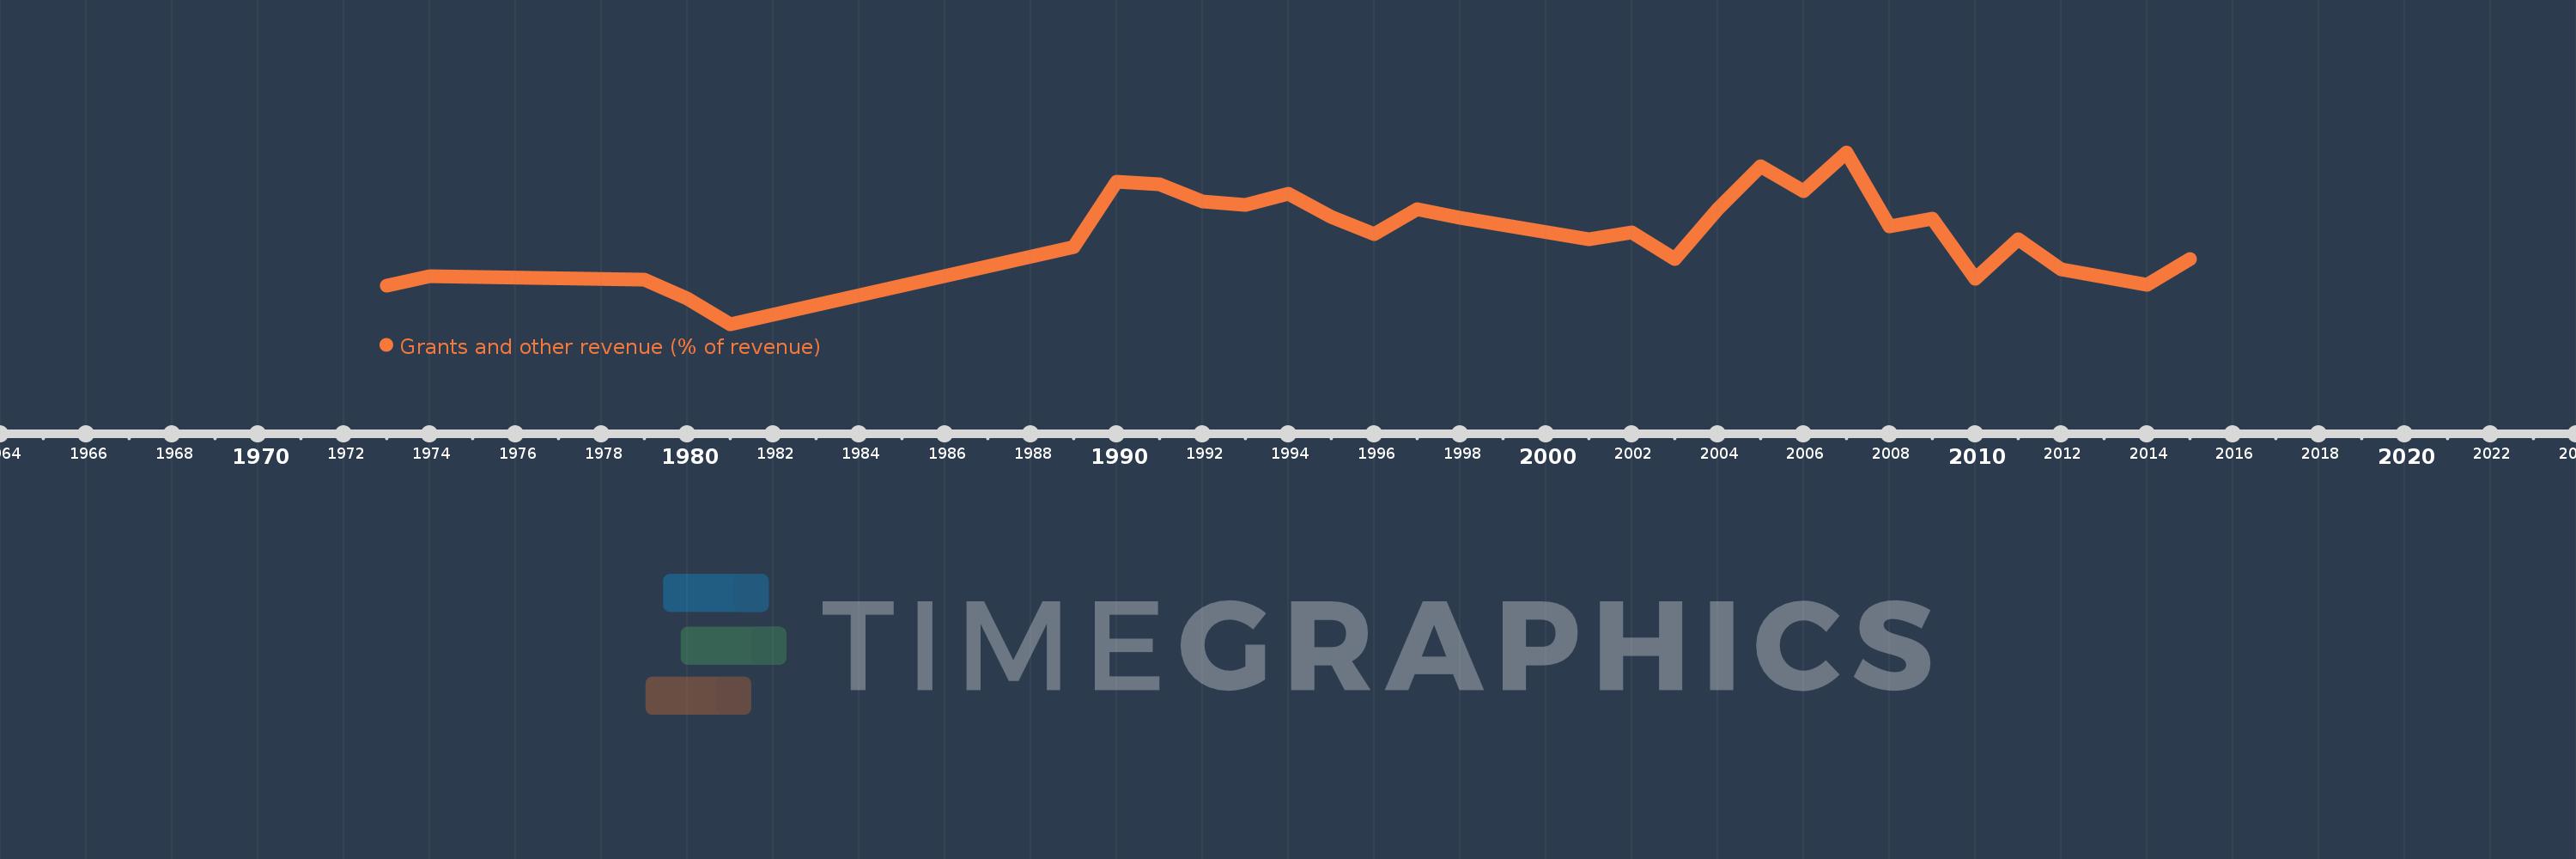
Grants and other revenue (% of revenue)
2015,2014,2013,2012,2011,2010,2009,2008,2007,2006,2005,2004,2003,2002,2001,1998,1997,1996,1995,1994,1993,1992,1991,1990,1989,1981,1980,1979,1974,1973
This statistics in other country:
AfghanistanAlbaniaAlgeriaAngolaAntigua and BarbudaArab WorldArgentinaArmeniaAustraliaAustriaAzerbaijanBahamas, TheBahrainBangladeshBarbadosBelarusBelgiumBelizeBeninBhutanBoliviaBosnia and HerzegovinaBotswanaBrazilBulgariaBurkina FasoBurundiCabo VerdeCambodiaCanadaCaribbean small statesCentral African RepublicCentral Europe and the BalticsChileChinaColombiaCongo, Dem. Rep.Congo, Rep.Costa RicaCote d'IvoireCroatiaCyprusCzech RepublicDenmarkDominicaDominican RepublicEarly-demographic dividendEast Asia & PacificEast Asia & Pacific (excluding high income)East Asia & Pacific (IDA & IBRD countries)Egypt, Arab Rep.El SalvadorEquatorial GuineaEstoniaEthiopiaEuro areaEurope & Central AsiaEurope & Central Asia (excluding high income)Europe & Central Asia (IDA & IBRD countries)European UnionFijiFinlandFranceGambia, TheGeorgiaGermanyGhanaGreeceGrenadaGuatemalaHeavily indebted poor countries (HIPC)High incomeHondurasHong Kong SAR, ChinaHungaryIBRD onlyIcelandIDA & IBRD totalIDA blendIDA onlyIDA totalIndiaIndonesiaIran, Islamic Rep.IraqIrelandIsraelItalyJamaicaJapanJordanKazakhstanKenyaKiribatiKorea, Rep.KuwaitKyrgyz RepublicLao PDRLate-demographic dividendLatin America & Caribbean Latin America & Caribbean (excluding high income)Latin America & the Caribbean (IDA & IBRD countries)LatviaLeast developed countries: UN classificationLebanonLesothoLiberiaLithuaniaLow & middle incomeLow incomeLower middle incomeLuxembourgMacao SAR, ChinaMacedonia, FYRMadagascarMalawiMalaysiaMaldivesMaliMaltaMauritiusMexicoMicronesia, Fed. Sts.Middle East & North AfricaMiddle East & North Africa (excluding high income)Middle East & North Africa (IDA & IBRD countries)Middle incomeMoldovaMongoliaMoroccoMozambiqueMyanmarNamibiaNepalNetherlandsNew ZealandNicaraguaNigeriaNorth AmericaNorwayOECD membersOmanOther small statesPakistanPanamaPapua New GuineaParaguayPeruPhilippinesPolandPortugalPost-demographic dividendPre-demographic dividendQatarRomaniaRussian FederationRwandaSamoaSan MarinoSao Tome and PrincipeSenegalSerbiaSeychellesSierra LeoneSingaporeSlovak RepublicSloveniaSmall statesSolomon IslandsSouth AfricaSouth AsiaSouth Asia (IDA & IBRD)SpainSri LankaSt. Kitts and NevisSt. LuciaSt. Vincent and the GrenadinesSub-Saharan Africa Sub-Saharan Africa (excluding high income)Sub-Saharan Africa (IDA & IBRD countries)SurinameSwazilandSwedenSwitzerlandSyrian Arab RepublicTajikistanTanzaniaThailandTimor-LesteTogoTrinidad and TobagoTunisiaTurkeyUgandaUkraineUnited Arab EmiratesUnited KingdomUnited StatesUpper middle incomeUruguayVanuatuVenezuela, RBVietnamWest Bank and GazaWorldYemen, Rep.ZambiaZimbabwe Timeline:
This timeline shows a graph from 1973 to 2015 of Madagascar. No data until 1972. Number of actual observations by date: 30.
Source name:
World Development Indicators
Source organization:
International Monetary Fund, Government Finance Statistics Yearbook and data files.
Categories, topics:
Public Sector
Last updated:
apr 23, 2017
Indicators value changes by year
Maximum:
50.317
jan 1, 2007
At the date of observation
Value
Absolute change
Change from previous value
jan 1, 1973
12.876
+12.876
0.0%
jan 1, 1974
15.426
+2.55
19.8%
jan 1, 1979
14.618
-0.807
-5.23%
jan 1, 1980
9.357
-5.261
-35.99%
jan 1, 1981
2.051
-7.307
-78.08%
jan 1, 1989
23.763
+21.712
1.06K%
jan 1, 1990
41.979
+18.216
76.66%
jan 1, 1991
41.372
-0.607
-1.45%
jan 1, 1992
36.465
-4.907
-11.86%
jan 1, 1993
35.676
-0.789
-2.16%
jan 1, 1994
38.708
+3.031
8.5%
jan 1, 1995
32.22
-6.488
-16.76%
jan 1, 1996
27.301
-4.919
-15.27%
jan 1, 1997
34.263
+6.962
25.5%
jan 1, 1998
32.0
-2.263
-6.6%
jan 1, 2001
25.963
-6.036
-18.86%
jan 1, 2002
27.929
+1.966
7.57%
jan 1, 2003
20.411
-7.518
-26.92%
jan 1, 2004
34.298
+13.887
68.04%
jan 1, 2005
46.455
+12.157
35.44%
jan 1, 2006
39.475
-6.979
-15.02%
jan 1, 2007
50.317
+10.842
27.46%
jan 1, 2008
29.436
-20.881
-41.5%
jan 1, 2009
31.722
+2.286
7.77%
jan 1, 2010
14.787
-16.935
-53.38%
jan 1, 2011
25.926
+11.139
75.33%
jan 1, 2012
17.417
-8.509
-32.82%
jan 1, 2013
15.301
-2.116
-12.15%
jan 1, 2014
13.236
-2.065
-13.5%
jan 1, 2015
20.479
+7.244
54.73%
Ranking of countries by current statistics by years


Comments: