29
/
en
AIzaSyAYiBZKx7MnpbEhh9jyipgxe19OcubqV5w
April 1, 2024
153580
Iceland
ISL
true
2
1
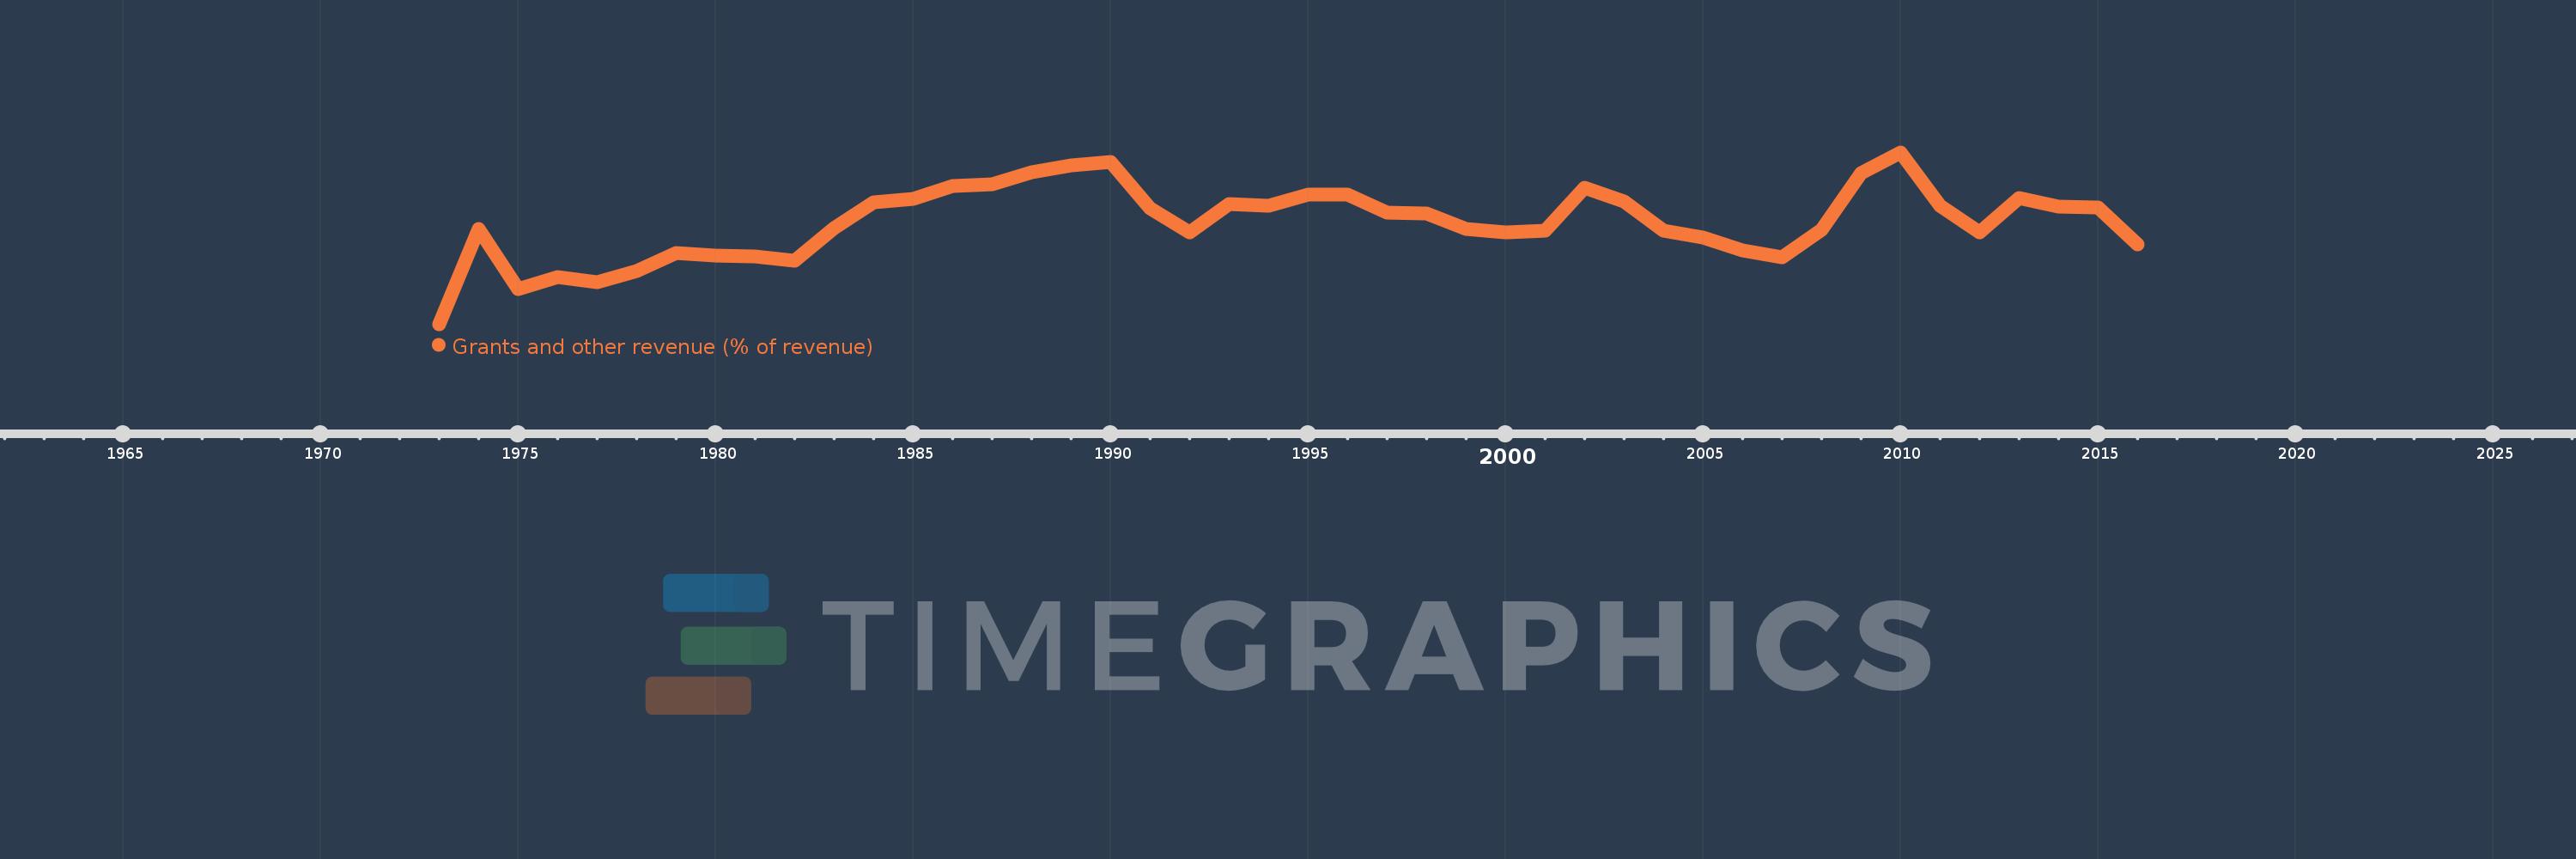
Grants and other revenue (% of revenue)
2016,2015,2014,2013,2012,2011,2010,2009,2008,2007,2006,2005,2004,2003,2002,2001,2000,1999,1998,1997,1996,1995,1994,1993,1992,1991,1990,1989,1988,1987,1986,1985,1984,1983,1982,1981,1980,1979,1978,1977,1976,1975,1974,1973
This statistics in other country:
AfghanistanAlbaniaAlgeriaAngolaAntigua and BarbudaArab WorldArgentinaArmeniaAustraliaAustriaAzerbaijanBahamas, TheBahrainBangladeshBarbadosBelarusBelgiumBelizeBeninBhutanBoliviaBosnia and HerzegovinaBotswanaBrazilBulgariaBurkina FasoBurundiCabo VerdeCambodiaCanadaCaribbean small statesCentral African RepublicCentral Europe and the BalticsChileChinaColombiaCongo, Dem. Rep.Congo, Rep.Costa RicaCote d'IvoireCroatiaCyprusCzech RepublicDenmarkDominicaDominican RepublicEarly-demographic dividendEast Asia & PacificEast Asia & Pacific (excluding high income)East Asia & Pacific (IDA & IBRD countries)Egypt, Arab Rep.El SalvadorEquatorial GuineaEstoniaEthiopiaEuro areaEurope & Central AsiaEurope & Central Asia (excluding high income)Europe & Central Asia (IDA & IBRD countries)European UnionFijiFinlandFranceGambia, TheGeorgiaGermanyGhanaGreeceGrenadaGuatemalaHeavily indebted poor countries (HIPC)High incomeHondurasHong Kong SAR, ChinaHungaryIBRD onlyIcelandIDA & IBRD totalIDA blendIDA onlyIDA totalIndiaIndonesiaIran, Islamic Rep.IraqIrelandIsraelItalyJamaicaJapanJordanKazakhstanKenyaKiribatiKorea, Rep.KuwaitKyrgyz RepublicLao PDRLate-demographic dividendLatin America & Caribbean Latin America & Caribbean (excluding high income)Latin America & the Caribbean (IDA & IBRD countries)LatviaLeast developed countries: UN classificationLebanonLesothoLiberiaLithuaniaLow & middle incomeLow incomeLower middle incomeLuxembourgMacao SAR, ChinaMacedonia, FYRMadagascarMalawiMalaysiaMaldivesMaliMaltaMauritiusMexicoMicronesia, Fed. Sts.Middle East & North AfricaMiddle East & North Africa (excluding high income)Middle East & North Africa (IDA & IBRD countries)Middle incomeMoldovaMongoliaMoroccoMozambiqueMyanmarNamibiaNepalNetherlandsNew ZealandNicaraguaNigeriaNorth AmericaNorwayOECD membersOmanOther small statesPakistanPanamaPapua New GuineaParaguayPeruPhilippinesPolandPortugalPost-demographic dividendPre-demographic dividendQatarRomaniaRussian FederationRwandaSamoaSan MarinoSao Tome and PrincipeSenegalSerbiaSeychellesSierra LeoneSingaporeSlovak RepublicSloveniaSmall statesSolomon IslandsSouth AfricaSouth AsiaSouth Asia (IDA & IBRD)SpainSri LankaSt. Kitts and NevisSt. LuciaSt. Vincent and the GrenadinesSub-Saharan Africa Sub-Saharan Africa (excluding high income)Sub-Saharan Africa (IDA & IBRD countries)SurinameSwazilandSwedenSwitzerlandSyrian Arab RepublicTajikistanTanzaniaThailandTimor-LesteTogoTrinidad and TobagoTunisiaTurkeyUgandaUkraineUnited Arab EmiratesUnited KingdomUnited StatesUpper middle incomeUruguayVanuatuVenezuela, RBVietnamWest Bank and GazaWorldYemen, Rep.ZambiaZimbabwe Timeline:
This timeline shows a graph from 1973 to 2016 of Iceland. No data until 1972. Number of actual observations by date: 44.
Source name:
World Development Indicators
Source organization:
International Monetary Fund, Government Finance Statistics Yearbook and data files.
Categories, topics:
Public Sector
Last updated:
apr 23, 2017
Indicators value changes by year
Maximum:
17.412
jan 1, 2010
At the date of observation
Value
Absolute change
Change from previous value
jan 1, 1973
7.804
+7.804
0.0%
jan 1, 1974
13.135
+5.331
68.32%
jan 1, 1975
9.774
-3.361
-25.59%
jan 1, 1976
10.447
+0.674
6.89%
jan 1, 1977
10.138
-0.31
-2.96%
jan 1, 1978
10.8
+0.662
6.53%
jan 1, 1979
11.808
+1.008
9.34%
jan 1, 1980
11.625
-0.183
-1.55%
jan 1, 1981
11.607
-0.018
-0.15%
jan 1, 1982
11.358
-0.249
-2.14%
jan 1, 1983
13.191
+1.833
16.14%
jan 1, 1984
14.598
+1.407
10.66%
jan 1, 1985
14.797
+0.199
1.37%
jan 1, 1986
15.543
+0.746
5.04%
jan 1, 1987
15.649
+0.106
0.68%
jan 1, 1988
16.314
+0.664
4.25%
jan 1, 1989
16.681
+0.368
2.25%
jan 1, 1990
16.864
+0.183
1.09%
jan 1, 1991
14.294
-2.57
-15.24%
jan 1, 1992
12.947
-1.348
-9.43%
jan 1, 1993
14.513
+1.567
12.1%
jan 1, 1994
14.412
-0.101
-0.7%
jan 1, 1995
15.075
+0.663
4.6%
jan 1, 1996
15.059
-0.016
-0.11%
jan 1, 1997
14.057
-1.002
-6.65%
jan 1, 1998
13.996
-0.062
-0.44%
jan 1, 1999
13.114
-0.882
-6.3%
jan 1, 2000
12.955
-0.159
-1.21%
jan 1, 2001
13.012
+0.057
0.44%
jan 1, 2002
15.428
+2.416
18.57%
jan 1, 2003
14.656
-0.772
-5.0%
jan 1, 2004
13.038
-1.618
-11.04%
jan 1, 2005
12.635
-0.403
-3.09%
jan 1, 2006
11.915
-0.72
-5.7%
jan 1, 2007
11.524
-0.391
-3.28%
jan 1, 2008
13.072
+1.548
13.43%
jan 1, 2009
16.263
+3.192
24.42%
jan 1, 2010
17.412
+1.149
7.06%
jan 1, 2011
14.445
-2.968
-17.04%
jan 1, 2012
12.924
-1.521
-10.53%
jan 1, 2013
14.869
+1.945
15.05%
jan 1, 2014
14.368
-0.501
-3.37%
jan 1, 2015
14.316
-0.052
-0.36%
jan 1, 2016
12.257
-2.059
-14.38%
Ranking of countries by current statistics by years


Comments: