29
/
en
AIzaSyAYiBZKx7MnpbEhh9jyipgxe19OcubqV5w
April 1, 2024
207979
Netherlands
NLD
true
2
1
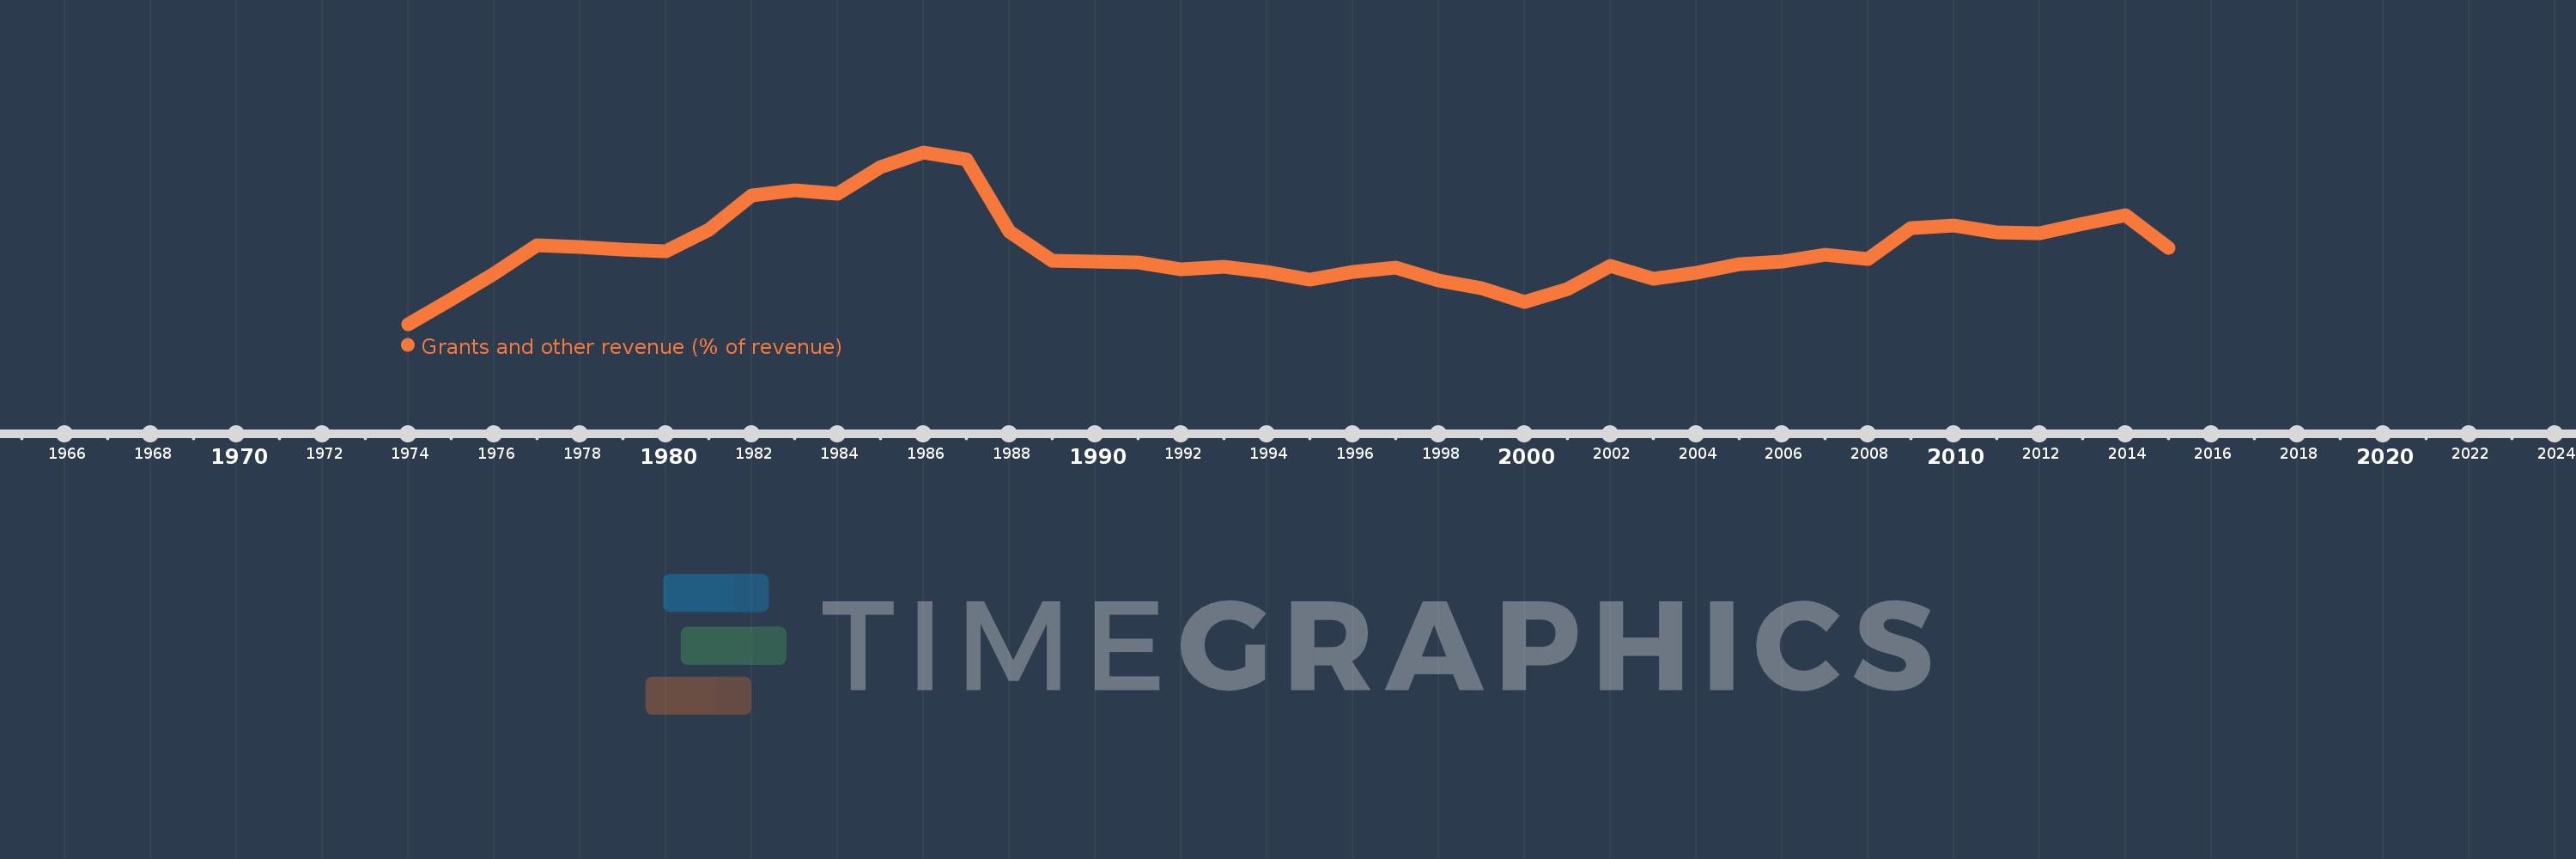
Grants and other revenue (% of revenue)
2015,2014,2013,2012,2011,2010,2009,2008,2007,2006,2005,2004,2003,2002,2001,2000,1999,1998,1997,1996,1995,1994,1993,1992,1991,1990,1989,1988,1987,1986,1985,1984,1983,1982,1981,1980,1979,1978,1977,1976,1975,1974
This statistics in other country:
AfghanistanAlbaniaAlgeriaAngolaAntigua and BarbudaArab WorldArgentinaArmeniaAustraliaAustriaAzerbaijanBahamas, TheBahrainBangladeshBarbadosBelarusBelgiumBelizeBeninBhutanBoliviaBosnia and HerzegovinaBotswanaBrazilBulgariaBurkina FasoBurundiCabo VerdeCambodiaCanadaCaribbean small statesCentral African RepublicCentral Europe and the BalticsChileChinaColombiaCongo, Dem. Rep.Congo, Rep.Costa RicaCote d'IvoireCroatiaCyprusCzech RepublicDenmarkDominicaDominican RepublicEarly-demographic dividendEast Asia & PacificEast Asia & Pacific (excluding high income)East Asia & Pacific (IDA & IBRD countries)Egypt, Arab Rep.El SalvadorEquatorial GuineaEstoniaEthiopiaEuro areaEurope & Central AsiaEurope & Central Asia (excluding high income)Europe & Central Asia (IDA & IBRD countries)European UnionFijiFinlandFranceGambia, TheGeorgiaGermanyGhanaGreeceGrenadaGuatemalaHeavily indebted poor countries (HIPC)High incomeHondurasHong Kong SAR, ChinaHungaryIBRD onlyIcelandIDA & IBRD totalIDA blendIDA onlyIDA totalIndiaIndonesiaIran, Islamic Rep.IraqIrelandIsraelItalyJamaicaJapanJordanKazakhstanKenyaKiribatiKorea, Rep.KuwaitKyrgyz RepublicLao PDRLate-demographic dividendLatin America & Caribbean Latin America & Caribbean (excluding high income)Latin America & the Caribbean (IDA & IBRD countries)LatviaLeast developed countries: UN classificationLebanonLesothoLiberiaLithuaniaLow & middle incomeLow incomeLower middle incomeLuxembourgMacao SAR, ChinaMacedonia, FYRMadagascarMalawiMalaysiaMaldivesMaliMaltaMauritiusMexicoMicronesia, Fed. Sts.Middle East & North AfricaMiddle East & North Africa (excluding high income)Middle East & North Africa (IDA & IBRD countries)Middle incomeMoldovaMongoliaMoroccoMozambiqueMyanmarNamibiaNepalNetherlandsNew ZealandNicaraguaNigeriaNorth AmericaNorwayOECD membersOmanOther small statesPakistanPanamaPapua New GuineaParaguayPeruPhilippinesPolandPortugalPost-demographic dividendPre-demographic dividendQatarRomaniaRussian FederationRwandaSamoaSan MarinoSao Tome and PrincipeSenegalSerbiaSeychellesSierra LeoneSingaporeSlovak RepublicSloveniaSmall statesSolomon IslandsSouth AfricaSouth AsiaSouth Asia (IDA & IBRD)SpainSri LankaSt. Kitts and NevisSt. LuciaSt. Vincent and the GrenadinesSub-Saharan Africa Sub-Saharan Africa (excluding high income)Sub-Saharan Africa (IDA & IBRD countries)SurinameSwazilandSwedenSwitzerlandSyrian Arab RepublicTajikistanTanzaniaThailandTimor-LesteTogoTrinidad and TobagoTunisiaTurkeyUgandaUkraineUnited Arab EmiratesUnited KingdomUnited StatesUpper middle incomeUruguayVanuatuVenezuela, RBVietnamWest Bank and GazaWorldYemen, Rep.ZambiaZimbabwe Timeline:
This timeline shows a graph from 1974 to 2015 of Netherlands. No data until 1973. Number of actual observations by date: 42.
Source name:
World Development Indicators
Source organization:
International Monetary Fund, Government Finance Statistics Yearbook and data files.
Categories, topics:
Public Sector
Last updated:
apr 23, 2017
Indicators value changes by year
Maximum:
15.896
jan 1, 1986
At the date of observation
Value
Absolute change
Change from previous value
jan 1, 1974
5.076
+5.076
0.0%
jan 1, 1975
6.666
+1.59
31.31%
jan 1, 1976
8.253
+1.587
23.81%
jan 1, 1977
10.068
+1.815
21.99%
jan 1, 1978
9.939
-0.129
-1.28%
jan 1, 1979
9.804
-0.135
-1.35%
jan 1, 1980
9.694
-0.11
-1.13%
jan 1, 1981
11.02
+1.326
13.68%
jan 1, 1982
13.2
+2.18
19.78%
jan 1, 1983
13.525
+0.325
2.46%
jan 1, 1984
13.299
-0.226
-1.67%
jan 1, 1985
14.997
+1.698
12.77%
jan 1, 1986
15.896
+0.899
5.99%
jan 1, 1987
15.442
-0.454
-2.86%
jan 1, 1988
10.928
-4.513
-29.23%
jan 1, 1989
9.097
-1.831
-16.76%
jan 1, 1990
8.996
-0.102
-1.12%
jan 1, 1991
8.976
-0.019
-0.21%
jan 1, 1992
8.54
-0.436
-4.86%
jan 1, 1993
8.703
+0.163
1.91%
jan 1, 1994
8.345
-0.358
-4.11%
jan 1, 1995
7.891
-0.454
-5.44%
jan 1, 1996
8.385
+0.494
6.26%
jan 1, 1997
8.653
+0.268
3.2%
jan 1, 1998
7.845
-0.808
-9.34%
jan 1, 1999
7.366
-0.48
-6.11%
jan 1, 2000
6.457
-0.908
-12.33%
jan 1, 2001
7.286
+0.829
12.84%
jan 1, 2002
8.751
+1.465
20.11%
jan 1, 2003
7.951
-0.8
-9.15%
jan 1, 2004
8.328
+0.377
4.74%
jan 1, 2005
8.864
+0.537
6.45%
jan 1, 2006
9.012
+0.148
1.67%
jan 1, 2007
9.472
+0.46
5.1%
jan 1, 2008
9.193
-0.279
-2.95%
jan 1, 2009
11.139
+1.947
21.18%
jan 1, 2010
11.3
+0.161
1.45%
jan 1, 2011
10.883
-0.418
-3.7%
jan 1, 2012
10.81
-0.073
-0.67%
jan 1, 2013
11.42
+0.61
5.65%
jan 1, 2014
11.945
+0.524
4.59%
jan 1, 2015
9.891
-2.054
-17.2%
Ranking of countries by current statistics by years


Comments: