29
/
en
AIzaSyAYiBZKx7MnpbEhh9jyipgxe19OcubqV5w
April 1, 2024
269367
Turkey
TUR
true
2
1
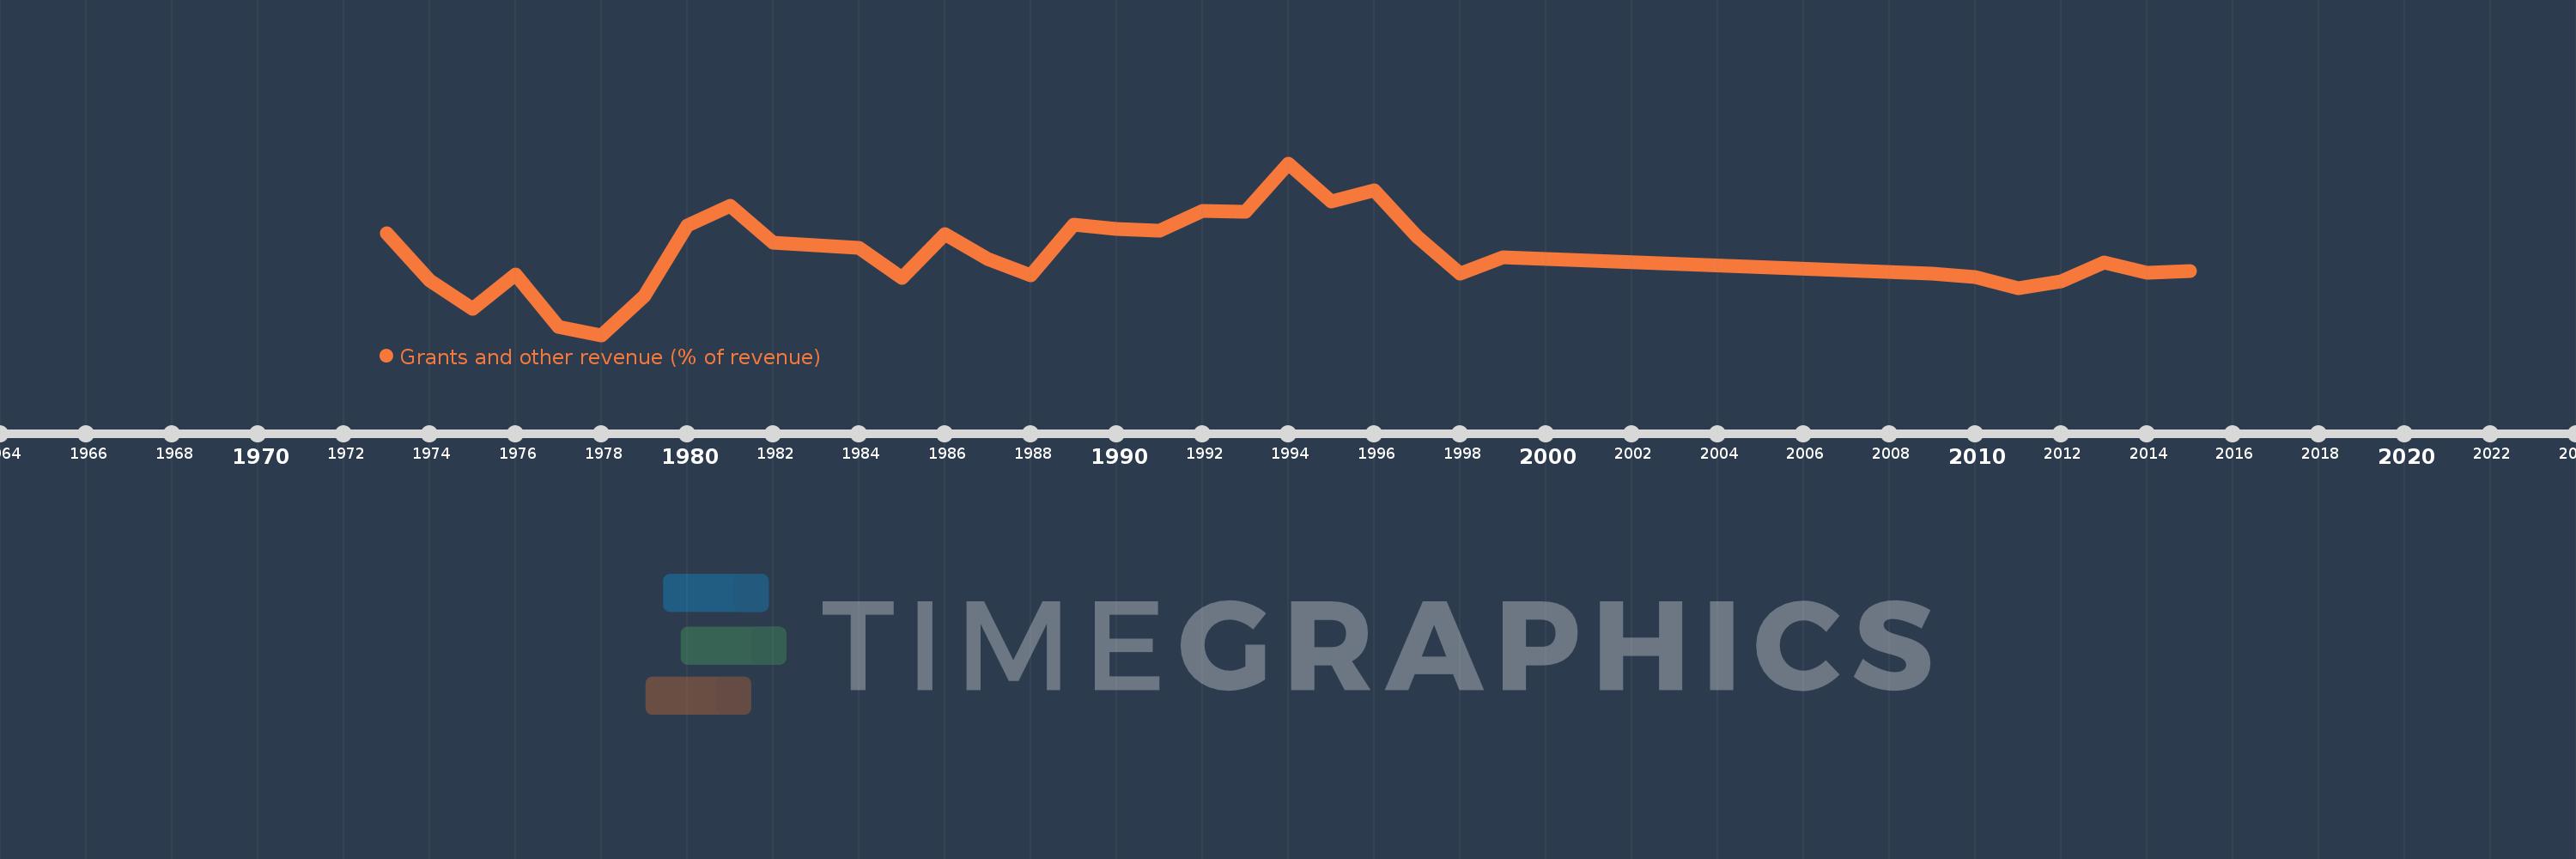
Grants and other revenue (% of revenue)
2015,2014,2013,2012,2011,2010,2009,1999,1998,1997,1996,1995,1994,1993,1992,1991,1990,1989,1988,1987,1986,1985,1984,1982,1981,1980,1979,1978,1977,1976,1975,1974,1973
This statistics in other country:
AfghanistanAlbaniaAlgeriaAngolaAntigua and BarbudaArab WorldArgentinaArmeniaAustraliaAustriaAzerbaijanBahamas, TheBahrainBangladeshBarbadosBelarusBelgiumBelizeBeninBhutanBoliviaBosnia and HerzegovinaBotswanaBrazilBulgariaBurkina FasoBurundiCabo VerdeCambodiaCanadaCaribbean small statesCentral African RepublicCentral Europe and the BalticsChileChinaColombiaCongo, Dem. Rep.Congo, Rep.Costa RicaCote d'IvoireCroatiaCyprusCzech RepublicDenmarkDominicaDominican RepublicEarly-demographic dividendEast Asia & PacificEast Asia & Pacific (excluding high income)East Asia & Pacific (IDA & IBRD countries)Egypt, Arab Rep.El SalvadorEquatorial GuineaEstoniaEthiopiaEuro areaEurope & Central AsiaEurope & Central Asia (excluding high income)Europe & Central Asia (IDA & IBRD countries)European UnionFijiFinlandFranceGambia, TheGeorgiaGermanyGhanaGreeceGrenadaGuatemalaHeavily indebted poor countries (HIPC)High incomeHondurasHong Kong SAR, ChinaHungaryIBRD onlyIcelandIDA & IBRD totalIDA blendIDA onlyIDA totalIndiaIndonesiaIran, Islamic Rep.IraqIrelandIsraelItalyJamaicaJapanJordanKazakhstanKenyaKiribatiKorea, Rep.KuwaitKyrgyz RepublicLao PDRLate-demographic dividendLatin America & Caribbean Latin America & Caribbean (excluding high income)Latin America & the Caribbean (IDA & IBRD countries)LatviaLeast developed countries: UN classificationLebanonLesothoLiberiaLithuaniaLow & middle incomeLow incomeLower middle incomeLuxembourgMacao SAR, ChinaMacedonia, FYRMadagascarMalawiMalaysiaMaldivesMaliMaltaMauritiusMexicoMicronesia, Fed. Sts.Middle East & North AfricaMiddle East & North Africa (excluding high income)Middle East & North Africa (IDA & IBRD countries)Middle incomeMoldovaMongoliaMoroccoMozambiqueMyanmarNamibiaNepalNetherlandsNew ZealandNicaraguaNigeriaNorth AmericaNorwayOECD membersOmanOther small statesPakistanPanamaPapua New GuineaParaguayPeruPhilippinesPolandPortugalPost-demographic dividendPre-demographic dividendQatarRomaniaRussian FederationRwandaSamoaSan MarinoSao Tome and PrincipeSenegalSerbiaSeychellesSierra LeoneSingaporeSlovak RepublicSloveniaSmall statesSolomon IslandsSouth AfricaSouth AsiaSouth Asia (IDA & IBRD)SpainSri LankaSt. Kitts and NevisSt. LuciaSt. Vincent and the GrenadinesSub-Saharan Africa Sub-Saharan Africa (excluding high income)Sub-Saharan Africa (IDA & IBRD countries)SurinameSwazilandSwedenSwitzerlandSyrian Arab RepublicTajikistanTanzaniaThailandTimor-LesteTogoTrinidad and TobagoTunisiaTurkeyUgandaUkraineUnited Arab EmiratesUnited KingdomUnited StatesUpper middle incomeUruguayVanuatuVenezuela, RBVietnamWest Bank and GazaWorldYemen, Rep.ZambiaZimbabwe Timeline:
This timeline shows a graph from 1973 to 2015 of Turkey. No data until 1972. Number of actual observations by date: 33.
Source name:
World Development Indicators
Source organization:
International Monetary Fund, Government Finance Statistics Yearbook and data files.
Categories, topics:
Public Sector
Last updated:
apr 23, 2017
Indicators value changes by year
Maximum:
25.594
jan 1, 1994
At the date of observation
Value
Absolute change
Change from previous value
jan 1, 1973
17.511
+17.511
0.0%
jan 1, 1974
12.142
-5.369
-30.66%
jan 1, 1975
8.799
-3.343
-27.53%
jan 1, 1976
12.776
+3.977
45.2%
jan 1, 1977
6.82
-5.956
-46.62%
jan 1, 1978
5.832
-0.988
-14.48%
jan 1, 1979
10.364
+4.532
77.71%
jan 1, 1980
18.381
+8.018
77.36%
jan 1, 1981
20.66
+2.279
12.4%
jan 1, 1982
16.425
-4.235
-20.5%
jan 1, 1984
15.869
-0.556
-3.38%
jan 1, 1985
12.39
-3.48
-21.93%
jan 1, 1986
17.401
+5.011
40.44%
jan 1, 1987
14.617
-2.784
-16.0%
jan 1, 1988
12.655
-1.962
-13.42%
jan 1, 1989
18.543
+5.888
46.52%
jan 1, 1990
18.04
-0.503
-2.71%
jan 1, 1991
17.861
-0.179
-0.99%
jan 1, 1992
20.097
+2.236
12.52%
jan 1, 1993
20.009
-0.087
-0.44%
jan 1, 1994
25.594
+5.584
27.91%
jan 1, 1995
21.169
-4.424
-17.29%
jan 1, 1996
22.503
+1.333
6.3%
jan 1, 1997
17.173
-5.33
-23.69%
jan 1, 1998
12.944
-4.229
-24.62%
jan 1, 1999
14.814
+1.87
14.45%
jan 1, 2009
12.864
-1.95
-13.16%
jan 1, 2010
12.551
-0.313
-2.44%
jan 1, 2011
11.246
-1.305
-10.4%
jan 1, 2012
12.055
+0.809
7.2%
jan 1, 2013
14.229
+2.174
18.03%
jan 1, 2014
13.032
-1.197
-8.41%
jan 1, 2015
13.228
+0.196
1.5%
Ranking of countries by current statistics by years


Comments: