30
/
AIzaSyAYiBZKx7MnpbEhh9jyipgxe19OcubqV5w
April 1, 2024
32638
Europe & Central Asia (IDA & IBRD countries)
TEC
false
2
1
Grants and other revenue (% of revenue)
2015,2014,2013,2012,2011,2010,2009,2008,2007,2006,2005,2004,2002,2001,2000,1999,1998
Download
Global statistics library →Europe & Central Asia (IDA & IBRD countries) →

Grants and other revenue (% of revenue)

This statistics in other country:

AfghanistanAlbaniaAlgeriaAngolaAntigua and BarbudaArab WorldArgentinaArmeniaAustraliaAustriaAzerbaijanBahamas, TheBahrainBangladeshBarbadosBelarusBelgiumBelizeBeninBhutanBoliviaBosnia and HerzegovinaBotswanaBrazilBulgariaBurkina FasoBurundiCabo VerdeCambodiaCanadaCaribbean small statesCentral African RepublicCentral Europe and the BalticsChileChinaColombiaCongo, Dem. Rep.Congo, Rep.Costa RicaCote d'IvoireCroatiaCyprusCzech RepublicDenmarkDominicaDominican RepublicEarly-demographic dividendEast Asia & PacificEast Asia & Pacific (excluding high income)East Asia & Pacific (IDA & IBRD countries)Egypt, Arab Rep.El SalvadorEquatorial GuineaEstoniaEthiopiaEuro areaEurope & Central AsiaEurope & Central Asia (excluding high income)Europe & Central Asia (IDA & IBRD countries)European UnionFijiFinlandFranceGambia, TheGeorgiaGermanyGhanaGreeceGrenadaGuatemalaHeavily indebted poor countries (HIPC)High incomeHondurasHong Kong SAR, ChinaHungaryIBRD onlyIcelandIDA & IBRD totalIDA blendIDA onlyIDA totalIndiaIndonesiaIran, Islamic Rep.IraqIrelandIsraelItalyJamaicaJapanJordanKazakhstanKenyaKiribatiKorea, Rep.KuwaitKyrgyz RepublicLao PDRLate-demographic dividendLatin America & Caribbean Latin America & Caribbean (excluding high income)Latin America & the Caribbean (IDA & IBRD countries)LatviaLeast developed countries: UN classificationLebanonLesothoLiberiaLithuaniaLow & middle incomeLow incomeLower middle incomeLuxembourgMacao SAR, ChinaMacedonia, FYRMadagascarMalawiMalaysiaMaldivesMaliMaltaMauritiusMexicoMicronesia, Fed. Sts.Middle East & North AfricaMiddle East & North Africa (excluding high income)Middle East & North Africa (IDA & IBRD countries)Middle incomeMoldovaMongoliaMoroccoMozambiqueMyanmarNamibiaNepalNetherlandsNew ZealandNicaraguaNigeriaNorth AmericaNorwayOECD membersOmanOther small statesPakistanPanamaPapua New GuineaParaguayPeruPhilippinesPolandPortugalPost-demographic dividendPre-demographic dividendQatarRomaniaRussian FederationRwandaSamoaSan MarinoSao Tome and PrincipeSenegalSerbiaSeychellesSierra LeoneSingaporeSlovak RepublicSloveniaSmall statesSolomon IslandsSouth AfricaSouth AsiaSouth Asia (IDA & IBRD)SpainSri LankaSt. Kitts and NevisSt. LuciaSt. Vincent and the GrenadinesSub-Saharan Africa Sub-Saharan Africa (excluding high income)Sub-Saharan Africa (IDA & IBRD countries)SurinameSwazilandSwedenSwitzerlandSyrian Arab RepublicTajikistanTanzaniaThailandTimor-LesteTogoTrinidad and TobagoTunisiaTurkeyUgandaUkraineUnited Arab EmiratesUnited KingdomUnited StatesUpper middle incomeUruguayVanuatuVenezuela, RBVietnamWest Bank and GazaWorldYemen, Rep.ZambiaZimbabwe

Timeline:

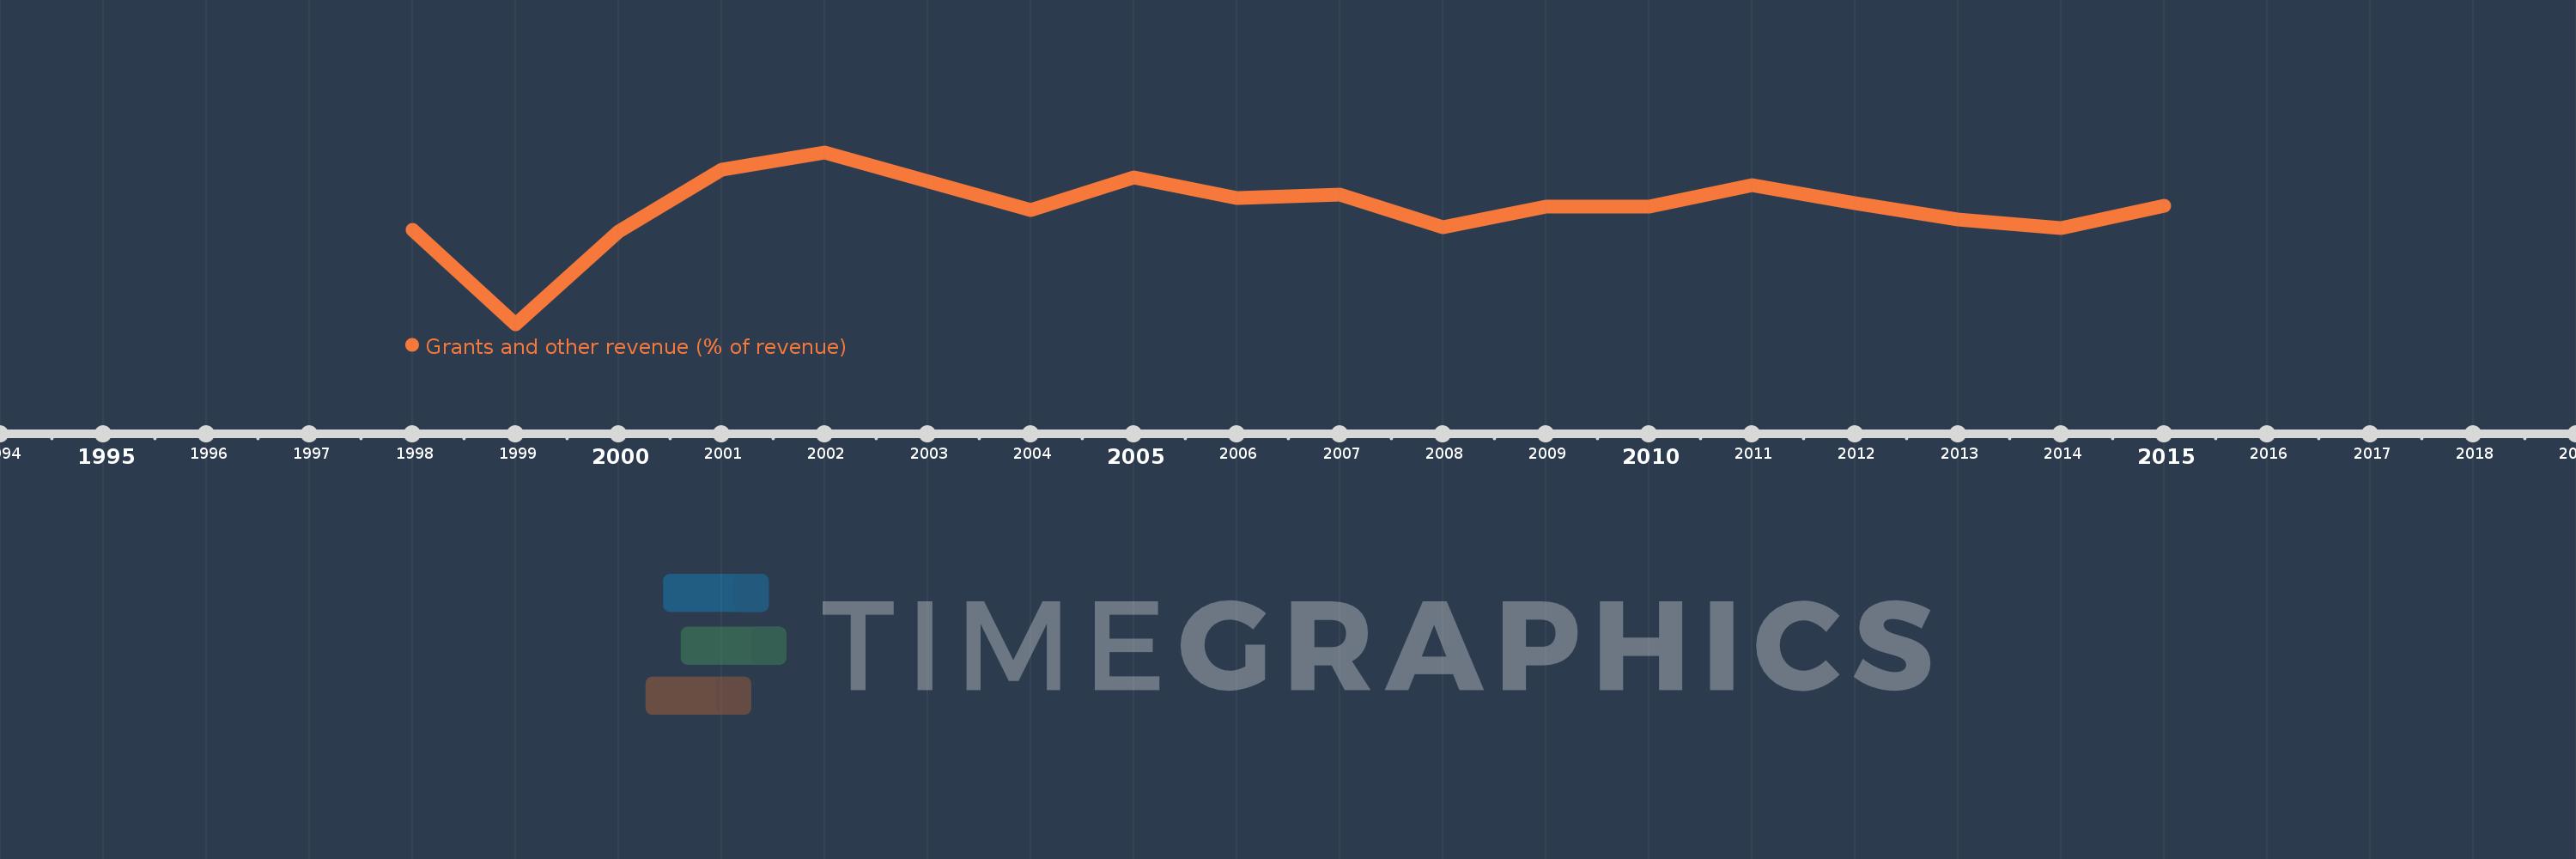
This timeline shows a graph from 1998 to 2015 of Europe & Central Asia (IDA & IBRD countries). No data until 1997. Number of actual observations by date: 17.

Source name:

World Development Indicators

Source organization:

International Monetary Fund, Government Finance Statistics Yearbook and data files.

Categories, topics:

Public Sector

Last updated:

apr 23, 2017

Indicators value changes by year

Meaning:
13.84
Minimum:
8.764
jan 1, 1999
Maximum:
16.399
jan 1, 2002
At the date of observation
Value
Absolute change
Change from the previous value
jan 1, 1998
12.944
+12.944
0.0%
jan 1, 1999
8.764
-4.18
-32.29%
jan 1, 2000
12.864
+4.1
46.78%
jan 1, 2001
15.625
+2.761
21.47%
jan 1, 2002
16.399
+0.774
4.96%
jan 1, 2004
13.847
-2.553
-15.57%
jan 1, 2005
15.295
+1.449
10.46%
jan 1, 2006
14.376
-0.919
-6.01%
jan 1, 2007
14.531
+0.155
1.08%
jan 1, 2008
13.066
-1.465
-10.08%
jan 1, 2009
13.992
+0.926
7.09%
jan 1, 2010
13.981
-0.011
-0.08%
jan 1, 2011
14.95
+0.969
6.93%
jan 1, 2012
14.159
-0.791
-5.29%
jan 1, 2013
13.414
-0.745
-5.26%
jan 1, 2014
13.032
-0.382
-2.85%
jan 1, 2015
14.035
+1.003
7.7%

Ranking of countries by current statistics by years