29
/
en
AIzaSyAYiBZKx7MnpbEhh9jyipgxe19OcubqV5w
April 1, 2024
245628
South Africa
ZAF
true
2
1
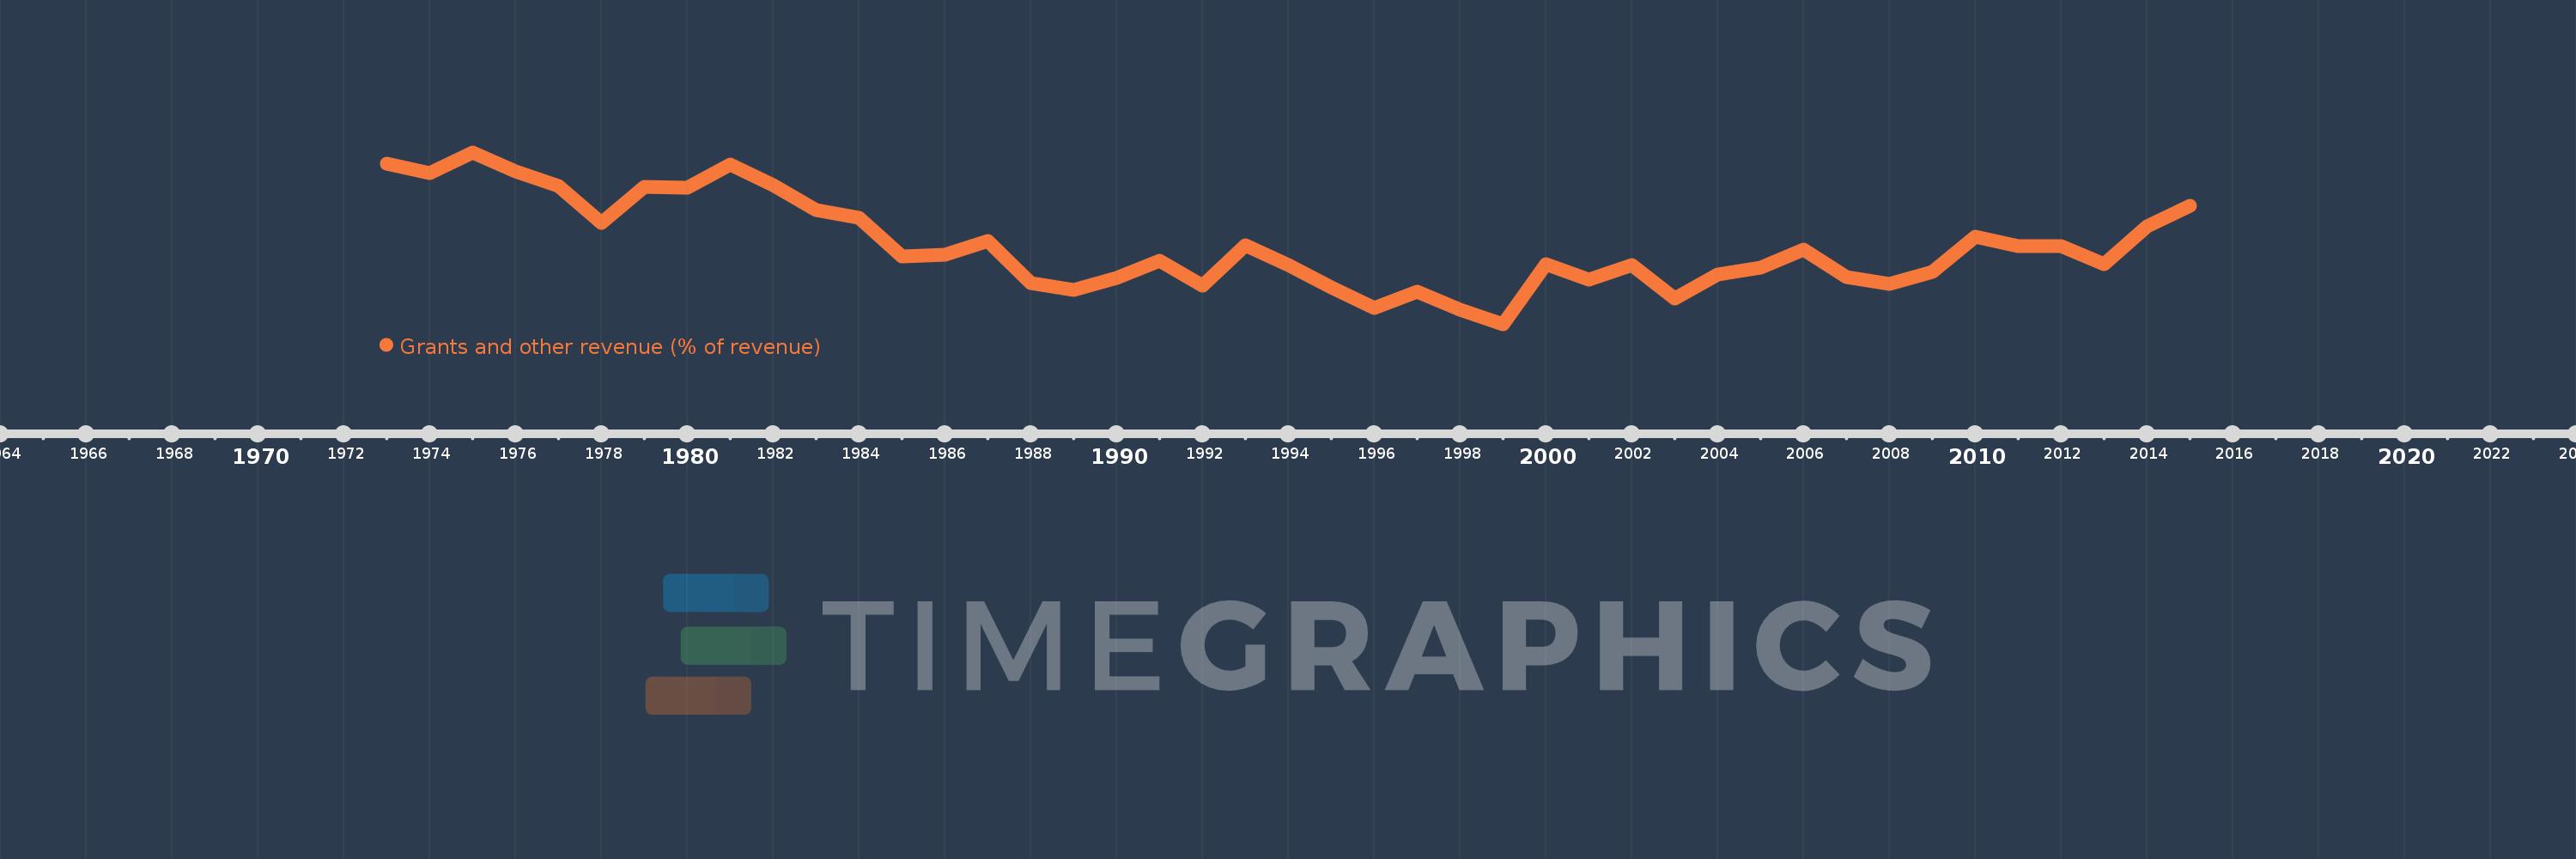
Grants and other revenue (% of revenue)
2015,2014,2013,2012,2011,2010,2009,2008,2007,2006,2005,2004,2003,2002,2001,2000,1999,1998,1997,1996,1995,1994,1993,1992,1991,1990,1989,1988,1987,1986,1985,1984,1983,1982,1981,1980,1979,1978,1977,1976,1975,1974,1973
This statistics in other country:
AfghanistanAlbaniaAlgeriaAngolaAntigua and BarbudaArab WorldArgentinaArmeniaAustraliaAustriaAzerbaijanBahamas, TheBahrainBangladeshBarbadosBelarusBelgiumBelizeBeninBhutanBoliviaBosnia and HerzegovinaBotswanaBrazilBulgariaBurkina FasoBurundiCabo VerdeCambodiaCanadaCaribbean small statesCentral African RepublicCentral Europe and the BalticsChileChinaColombiaCongo, Dem. Rep.Congo, Rep.Costa RicaCote d'IvoireCroatiaCyprusCzech RepublicDenmarkDominicaDominican RepublicEarly-demographic dividendEast Asia & PacificEast Asia & Pacific (excluding high income)East Asia & Pacific (IDA & IBRD countries)Egypt, Arab Rep.El SalvadorEquatorial GuineaEstoniaEthiopiaEuro areaEurope & Central AsiaEurope & Central Asia (excluding high income)Europe & Central Asia (IDA & IBRD countries)European UnionFijiFinlandFranceGambia, TheGeorgiaGermanyGhanaGreeceGrenadaGuatemalaHeavily indebted poor countries (HIPC)High incomeHondurasHong Kong SAR, ChinaHungaryIBRD onlyIcelandIDA & IBRD totalIDA blendIDA onlyIDA totalIndiaIndonesiaIran, Islamic Rep.IraqIrelandIsraelItalyJamaicaJapanJordanKazakhstanKenyaKiribatiKorea, Rep.KuwaitKyrgyz RepublicLao PDRLate-demographic dividendLatin America & Caribbean Latin America & Caribbean (excluding high income)Latin America & the Caribbean (IDA & IBRD countries)LatviaLeast developed countries: UN classificationLebanonLesothoLiberiaLithuaniaLow & middle incomeLow incomeLower middle incomeLuxembourgMacao SAR, ChinaMacedonia, FYRMadagascarMalawiMalaysiaMaldivesMaliMaltaMauritiusMexicoMicronesia, Fed. Sts.Middle East & North AfricaMiddle East & North Africa (excluding high income)Middle East & North Africa (IDA & IBRD countries)Middle incomeMoldovaMongoliaMoroccoMozambiqueMyanmarNamibiaNepalNetherlandsNew ZealandNicaraguaNigeriaNorth AmericaNorwayOECD membersOmanOther small statesPakistanPanamaPapua New GuineaParaguayPeruPhilippinesPolandPortugalPost-demographic dividendPre-demographic dividendQatarRomaniaRussian FederationRwandaSamoaSan MarinoSao Tome and PrincipeSenegalSerbiaSeychellesSierra LeoneSingaporeSlovak RepublicSloveniaSmall statesSolomon IslandsSouth AfricaSouth AsiaSouth Asia (IDA & IBRD)SpainSri LankaSt. Kitts and NevisSt. LuciaSt. Vincent and the GrenadinesSub-Saharan Africa Sub-Saharan Africa (excluding high income)Sub-Saharan Africa (IDA & IBRD countries)SurinameSwazilandSwedenSwitzerlandSyrian Arab RepublicTajikistanTanzaniaThailandTimor-LesteTogoTrinidad and TobagoTunisiaTurkeyUgandaUkraineUnited Arab EmiratesUnited KingdomUnited StatesUpper middle incomeUruguayVanuatuVenezuela, RBVietnamWest Bank and GazaWorldYemen, Rep.ZambiaZimbabwe Timeline:
This timeline shows a graph from 1973 to 2015 of South Africa. No data until 1972. Number of actual observations by date: 43.
Source name:
World Development Indicators
Source organization:
International Monetary Fund, Government Finance Statistics Yearbook and data files.
Categories, topics:
Public Sector
Last updated:
apr 23, 2017
Indicators value changes by year
Maximum:
13.395
jan 1, 1975
At the date of observation
Value
Absolute change
Change from previous value
jan 1, 1973
12.868
+12.868
0.0%
jan 1, 1974
12.401
-0.467
-3.63%
jan 1, 1975
13.395
+0.993
8.01%
jan 1, 1976
12.492
-0.903
-6.74%
jan 1, 1977
11.816
-0.676
-5.41%
jan 1, 1978
10.08
-1.736
-14.69%
jan 1, 1979
11.769
+1.688
16.75%
jan 1, 1980
11.743
-0.026
-0.22%
jan 1, 1981
12.814
+1.071
9.12%
jan 1, 1982
11.862
-0.952
-7.43%
jan 1, 1983
10.678
-1.185
-9.99%
jan 1, 1984
10.315
-0.362
-3.39%
jan 1, 1985
8.484
-1.832
-17.76%
jan 1, 1986
8.584
+0.1
1.18%
jan 1, 1987
9.206
+0.622
7.25%
jan 1, 1988
7.216
-1.99
-21.62%
jan 1, 1989
6.897
-0.319
-4.42%
jan 1, 1990
7.482
+0.585
8.48%
jan 1, 1991
8.304
+0.822
10.98%
jan 1, 1992
7.111
-1.193
-14.36%
jan 1, 1993
9.023
+1.912
26.88%
jan 1, 1994
8.104
-0.918
-10.18%
jan 1, 1995
7.046
-1.059
-13.06%
jan 1, 1996
6.052
-0.994
-14.1%
jan 1, 1997
6.822
+0.771
12.73%
jan 1, 1998
5.989
-0.833
-12.21%
jan 1, 1999
5.295
-0.695
-11.6%
jan 1, 2000
8.136
+2.841
53.66%
jan 1, 2001
7.385
-0.751
-9.23%
jan 1, 2002
8.098
+0.713
9.65%
jan 1, 2003
6.501
-1.597
-19.72%
jan 1, 2004
7.646
+1.145
17.62%
jan 1, 2005
7.975
+0.328
4.29%
jan 1, 2006
8.816
+0.842
10.56%
jan 1, 2007
7.502
-1.315
-14.91%
jan 1, 2008
7.179
-0.323
-4.3%
jan 1, 2009
7.756
+0.577
8.03%
jan 1, 2010
9.436
+1.68
21.66%
jan 1, 2011
8.992
-0.444
-4.7%
jan 1, 2012
8.964
-0.028
-0.31%
jan 1, 2013
8.107
-0.857
-9.56%
jan 1, 2014
9.905
+1.798
22.18%
jan 1, 2015
10.875
+0.97
9.79%
Ranking of countries by current statistics by years


Comments: