29
/
en
AIzaSyAYiBZKx7MnpbEhh9jyipgxe19OcubqV5w
April 1, 2024
222224
Peru
PER
true
2
1
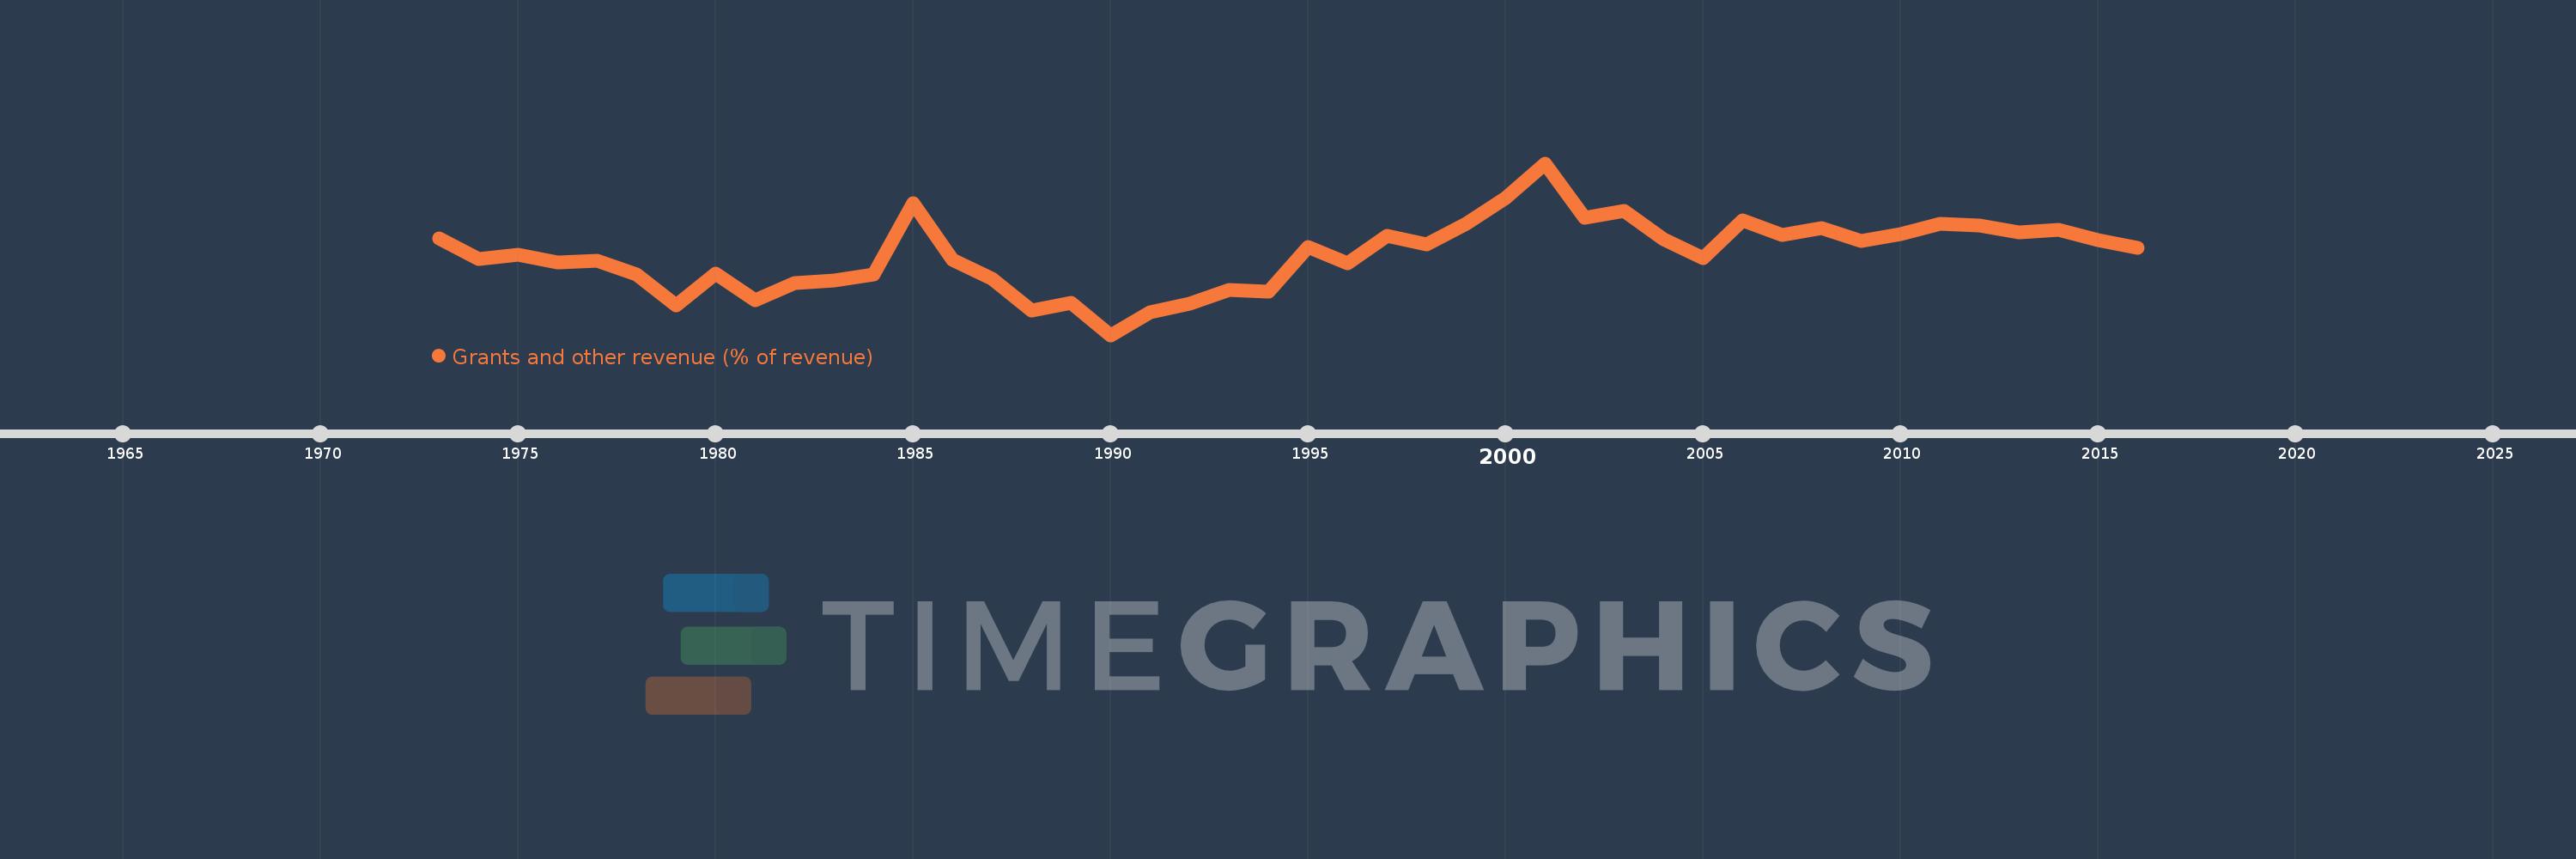
Grants and other revenue (% of revenue)
2016,2015,2014,2013,2012,2011,2010,2009,2008,2007,2006,2005,2004,2003,2002,2001,2000,1999,1998,1997,1996,1995,1994,1993,1992,1991,1990,1989,1988,1987,1986,1985,1984,1983,1982,1981,1980,1979,1978,1977,1976,1975,1974,1973
This statistics in other country:
AfghanistanAlbaniaAlgeriaAngolaAntigua and BarbudaArab WorldArgentinaArmeniaAustraliaAustriaAzerbaijanBahamas, TheBahrainBangladeshBarbadosBelarusBelgiumBelizeBeninBhutanBoliviaBosnia and HerzegovinaBotswanaBrazilBulgariaBurkina FasoBurundiCabo VerdeCambodiaCanadaCaribbean small statesCentral African RepublicCentral Europe and the BalticsChileChinaColombiaCongo, Dem. Rep.Congo, Rep.Costa RicaCote d'IvoireCroatiaCyprusCzech RepublicDenmarkDominicaDominican RepublicEarly-demographic dividendEast Asia & PacificEast Asia & Pacific (excluding high income)East Asia & Pacific (IDA & IBRD countries)Egypt, Arab Rep.El SalvadorEquatorial GuineaEstoniaEthiopiaEuro areaEurope & Central AsiaEurope & Central Asia (excluding high income)Europe & Central Asia (IDA & IBRD countries)European UnionFijiFinlandFranceGambia, TheGeorgiaGermanyGhanaGreeceGrenadaGuatemalaHeavily indebted poor countries (HIPC)High incomeHondurasHong Kong SAR, ChinaHungaryIBRD onlyIcelandIDA & IBRD totalIDA blendIDA onlyIDA totalIndiaIndonesiaIran, Islamic Rep.IraqIrelandIsraelItalyJamaicaJapanJordanKazakhstanKenyaKiribatiKorea, Rep.KuwaitKyrgyz RepublicLao PDRLate-demographic dividendLatin America & Caribbean Latin America & Caribbean (excluding high income)Latin America & the Caribbean (IDA & IBRD countries)LatviaLeast developed countries: UN classificationLebanonLesothoLiberiaLithuaniaLow & middle incomeLow incomeLower middle incomeLuxembourgMacao SAR, ChinaMacedonia, FYRMadagascarMalawiMalaysiaMaldivesMaliMaltaMauritiusMexicoMicronesia, Fed. Sts.Middle East & North AfricaMiddle East & North Africa (excluding high income)Middle East & North Africa (IDA & IBRD countries)Middle incomeMoldovaMongoliaMoroccoMozambiqueMyanmarNamibiaNepalNetherlandsNew ZealandNicaraguaNigeriaNorth AmericaNorwayOECD membersOmanOther small statesPakistanPanamaPapua New GuineaParaguayPeruPhilippinesPolandPortugalPost-demographic dividendPre-demographic dividendQatarRomaniaRussian FederationRwandaSamoaSan MarinoSao Tome and PrincipeSenegalSerbiaSeychellesSierra LeoneSingaporeSlovak RepublicSloveniaSmall statesSolomon IslandsSouth AfricaSouth AsiaSouth Asia (IDA & IBRD)SpainSri LankaSt. Kitts and NevisSt. LuciaSt. Vincent and the GrenadinesSub-Saharan Africa Sub-Saharan Africa (excluding high income)Sub-Saharan Africa (IDA & IBRD countries)SurinameSwazilandSwedenSwitzerlandSyrian Arab RepublicTajikistanTanzaniaThailandTimor-LesteTogoTrinidad and TobagoTunisiaTurkeyUgandaUkraineUnited Arab EmiratesUnited KingdomUnited StatesUpper middle incomeUruguayVanuatuVenezuela, RBVietnamWest Bank and GazaWorldYemen, Rep.ZambiaZimbabwe Timeline:
This timeline shows a graph from 1973 to 2016 of Peru. No data until 1972. Number of actual observations by date: 44.
Source name:
World Development Indicators
Source organization:
International Monetary Fund, Government Finance Statistics Yearbook and data files.
Categories, topics:
Public Sector
Last updated:
apr 23, 2017
Indicators value changes by year
Maximum:
20.445
jan 1, 2001
At the date of observation
Value
Absolute change
Change from previous value
jan 1, 1973
13.462
+13.462
0.0%
jan 1, 1974
11.538
-1.923
-14.29%
jan 1, 1975
11.94
+0.402
3.48%
jan 1, 1976
11.236
-0.704
-5.9%
jan 1, 1977
11.404
+0.168
1.49%
jan 1, 1978
10.063
-1.341
-11.76%
jan 1, 1979
7.224
-2.839
-28.21%
jan 1, 1980
10.163
+2.939
40.68%
jan 1, 1981
7.655
-2.509
-24.68%
jan 1, 1982
9.258
+1.603
20.95%
jan 1, 1983
9.497
+0.239
2.58%
jan 1, 1984
10.086
+0.589
6.2%
jan 1, 1985
16.716
+6.63
65.74%
jan 1, 1986
11.447
-5.268
-31.52%
jan 1, 1987
9.717
-1.731
-15.12%
jan 1, 1988
6.739
-2.978
-30.65%
jan 1, 1989
7.444
+0.706
10.47%
jan 1, 1990
4.454
-2.99
-40.17%
jan 1, 1991
6.558
+2.104
47.24%
jan 1, 1992
7.385
+0.827
12.61%
jan 1, 1993
8.636
+1.251
16.94%
jan 1, 1994
8.471
-0.164
-1.9%
jan 1, 1995
12.647
+4.175
49.29%
jan 1, 1996
11.166
-1.481
-11.71%
jan 1, 1997
13.66
+2.494
22.34%
jan 1, 1998
12.876
-0.784
-5.74%
jan 1, 1999
14.848
+1.972
15.31%
jan 1, 2000
17.197
+2.349
15.82%
jan 1, 2001
20.445
+3.248
18.89%
jan 1, 2002
15.377
-5.067
-24.79%
jan 1, 2003
16.022
+0.645
4.19%
jan 1, 2004
13.354
-2.668
-16.65%
jan 1, 2005
11.622
-1.732
-12.97%
jan 1, 2006
15.094
+3.472
29.88%
jan 1, 2007
13.803
-1.291
-8.55%
jan 1, 2008
14.377
+0.574
4.16%
jan 1, 2009
13.245
-1.133
-7.88%
jan 1, 2010
13.88
+0.635
4.8%
jan 1, 2011
14.783
+0.903
6.5%
jan 1, 2012
14.631
-0.152
-1.03%
jan 1, 2013
14.042
-0.588
-4.02%
jan 1, 2014
14.256
+0.213
1.52%
jan 1, 2015
13.28
-0.976
-6.85%
jan 1, 2016
12.572
-0.707
-5.32%
Ranking of countries by current statistics by years


Comments: