29
/
en
AIzaSyAYiBZKx7MnpbEhh9jyipgxe19OcubqV5w
April 1, 2024
276684
United States
USA
true
2
1
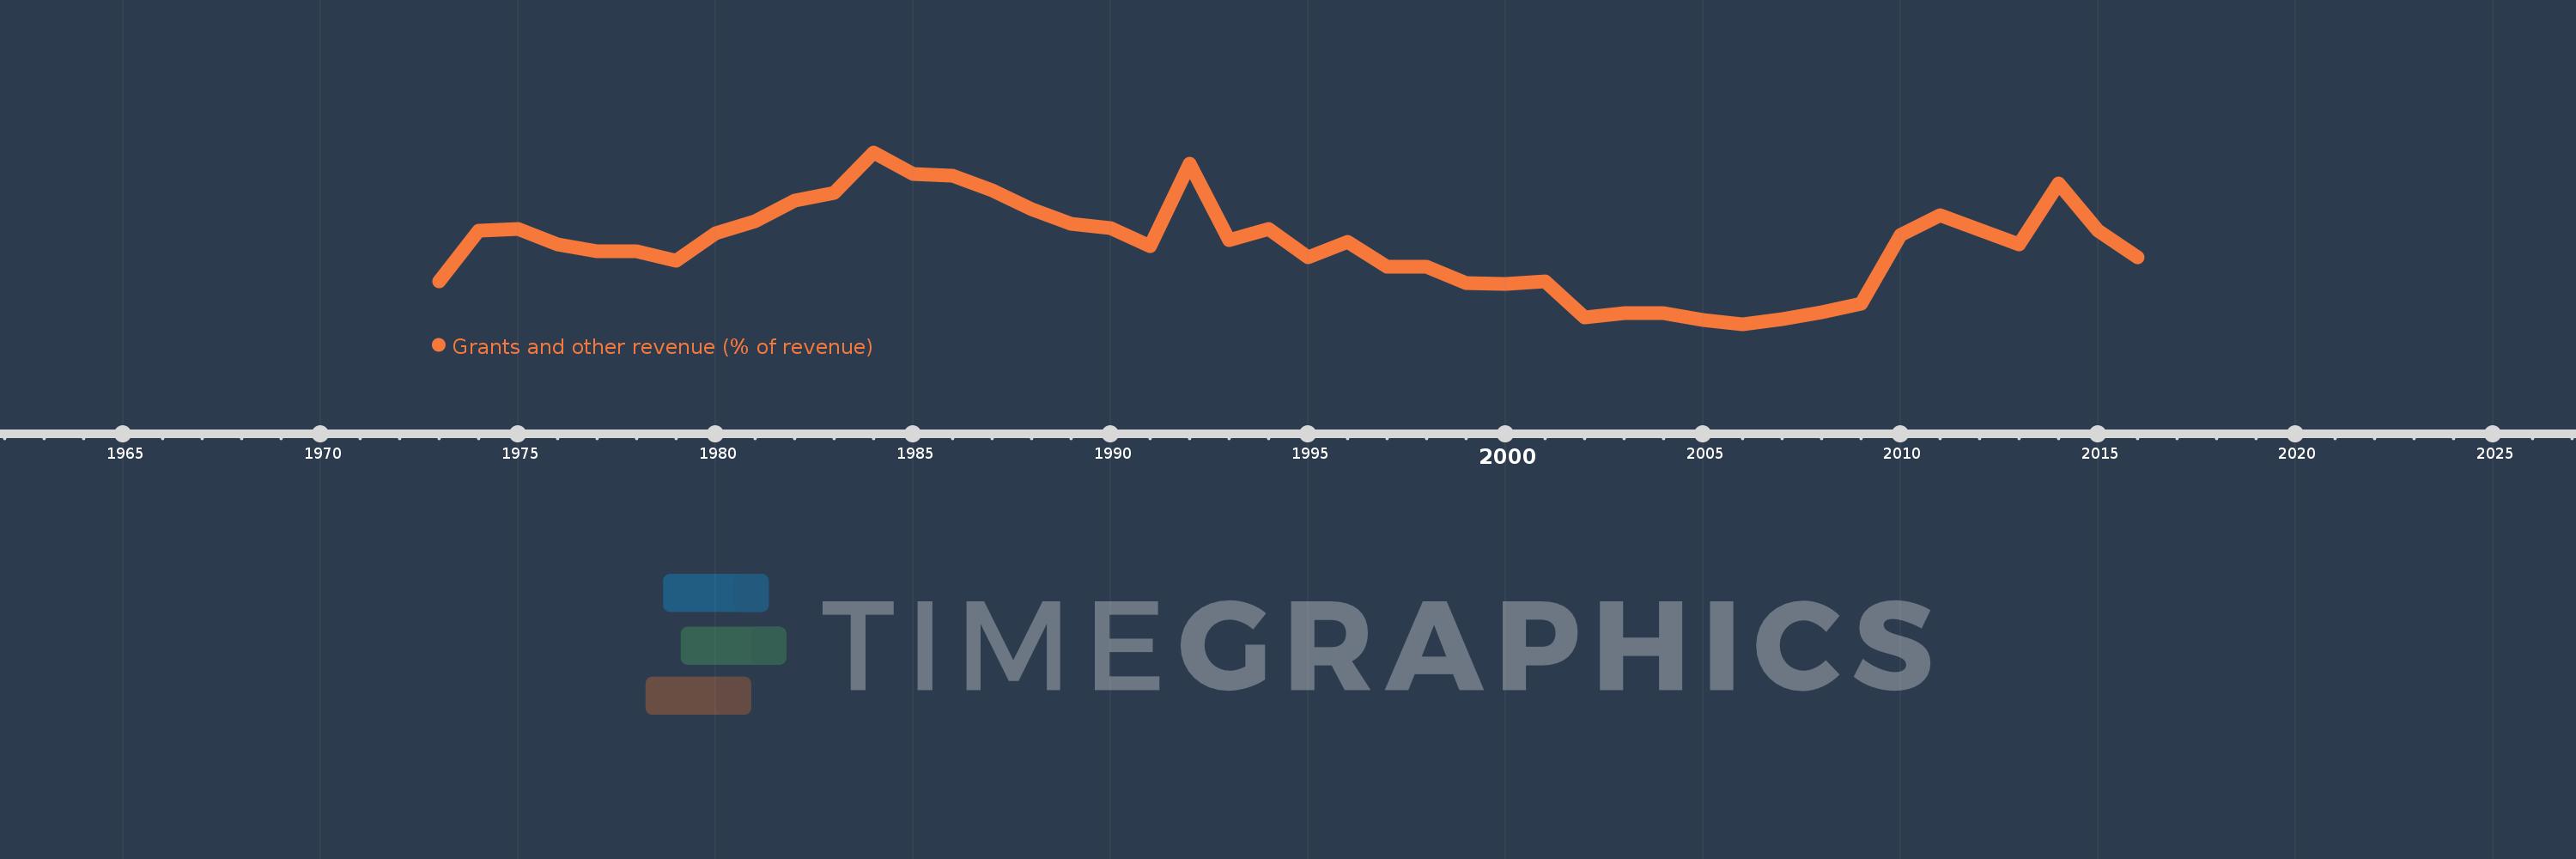
Grants and other revenue (% of revenue)
2016,2015,2014,2013,2012,2011,2010,2009,2008,2007,2006,2005,2004,2003,2002,2001,2000,1999,1998,1997,1996,1995,1994,1993,1992,1991,1990,1989,1988,1987,1986,1985,1984,1983,1982,1981,1980,1979,1978,1977,1976,1975,1974,1973
This statistics in other country:
AfghanistanAlbaniaAlgeriaAngolaAntigua and BarbudaArab WorldArgentinaArmeniaAustraliaAustriaAzerbaijanBahamas, TheBahrainBangladeshBarbadosBelarusBelgiumBelizeBeninBhutanBoliviaBosnia and HerzegovinaBotswanaBrazilBulgariaBurkina FasoBurundiCabo VerdeCambodiaCanadaCaribbean small statesCentral African RepublicCentral Europe and the BalticsChileChinaColombiaCongo, Dem. Rep.Congo, Rep.Costa RicaCote d'IvoireCroatiaCyprusCzech RepublicDenmarkDominicaDominican RepublicEarly-demographic dividendEast Asia & PacificEast Asia & Pacific (excluding high income)East Asia & Pacific (IDA & IBRD countries)Egypt, Arab Rep.El SalvadorEquatorial GuineaEstoniaEthiopiaEuro areaEurope & Central AsiaEurope & Central Asia (excluding high income)Europe & Central Asia (IDA & IBRD countries)European UnionFijiFinlandFranceGambia, TheGeorgiaGermanyGhanaGreeceGrenadaGuatemalaHeavily indebted poor countries (HIPC)High incomeHondurasHong Kong SAR, ChinaHungaryIBRD onlyIcelandIDA & IBRD totalIDA blendIDA onlyIDA totalIndiaIndonesiaIran, Islamic Rep.IraqIrelandIsraelItalyJamaicaJapanJordanKazakhstanKenyaKiribatiKorea, Rep.KuwaitKyrgyz RepublicLao PDRLate-demographic dividendLatin America & Caribbean Latin America & Caribbean (excluding high income)Latin America & the Caribbean (IDA & IBRD countries)LatviaLeast developed countries: UN classificationLebanonLesothoLiberiaLithuaniaLow & middle incomeLow incomeLower middle incomeLuxembourgMacao SAR, ChinaMacedonia, FYRMadagascarMalawiMalaysiaMaldivesMaliMaltaMauritiusMexicoMicronesia, Fed. Sts.Middle East & North AfricaMiddle East & North Africa (excluding high income)Middle East & North Africa (IDA & IBRD countries)Middle incomeMoldovaMongoliaMoroccoMozambiqueMyanmarNamibiaNepalNetherlandsNew ZealandNicaraguaNigeriaNorth AmericaNorwayOECD membersOmanOther small statesPakistanPanamaPapua New GuineaParaguayPeruPhilippinesPolandPortugalPost-demographic dividendPre-demographic dividendQatarRomaniaRussian FederationRwandaSamoaSan MarinoSao Tome and PrincipeSenegalSerbiaSeychellesSierra LeoneSingaporeSlovak RepublicSloveniaSmall statesSolomon IslandsSouth AfricaSouth AsiaSouth Asia (IDA & IBRD)SpainSri LankaSt. Kitts and NevisSt. LuciaSt. Vincent and the GrenadinesSub-Saharan Africa Sub-Saharan Africa (excluding high income)Sub-Saharan Africa (IDA & IBRD countries)SurinameSwazilandSwedenSwitzerlandSyrian Arab RepublicTajikistanTanzaniaThailandTimor-LesteTogoTrinidad and TobagoTunisiaTurkeyUgandaUkraineUnited Arab EmiratesUnited KingdomUnited StatesUpper middle incomeUruguayVanuatuVenezuela, RBVietnamWest Bank and GazaWorldYemen, Rep.ZambiaZimbabwe Timeline:
This timeline shows a graph from 1973 to 2016 of United States. No data until 1972. Number of actual observations by date: 44.
Source name:
World Development Indicators
Source organization:
International Monetary Fund, Government Finance Statistics Yearbook and data files.
Categories, topics:
Public Sector
Last updated:
apr 23, 2017
Indicators value changes by year
Maximum:
11.126
jan 1, 1984
At the date of observation
Value
Absolute change
Change from previous value
jan 1, 1973
5.713
+5.713
0.0%
jan 1, 1974
7.854
+2.141
37.48%
jan 1, 1975
7.914
+0.059
0.76%
jan 1, 1976
7.266
-0.648
-8.18%
jan 1, 1977
6.989
-0.277
-3.81%
jan 1, 1978
6.981
-0.008
-0.12%
jan 1, 1979
6.58
-0.401
-5.74%
jan 1, 1980
7.736
+1.156
17.57%
jan 1, 1981
8.24
+0.504
6.51%
jan 1, 1982
9.094
+0.854
10.36%
jan 1, 1983
9.424
+0.33
3.63%
jan 1, 1984
11.126
+1.702
18.07%
jan 1, 1985
10.207
-0.919
-8.26%
jan 1, 1986
10.166
-0.041
-0.4%
jan 1, 1987
9.536
-0.63
-6.2%
jan 1, 1988
8.753
-0.783
-8.21%
jan 1, 1989
8.124
-0.629
-7.19%
jan 1, 1990
7.968
-0.156
-1.92%
jan 1, 1991
7.184
-0.784
-9.84%
jan 1, 1992
10.667
+3.483
48.48%
jan 1, 1993
7.458
-3.208
-30.08%
jan 1, 1994
7.907
+0.448
6.01%
jan 1, 1995
6.743
-1.164
-14.72%
jan 1, 1996
7.384
+0.642
9.51%
jan 1, 1997
6.319
-1.066
-14.43%
jan 1, 1998
6.338
+0.019
0.3%
jan 1, 1999
5.658
-0.68
-10.73%
jan 1, 2000
5.598
-0.06
-1.06%
jan 1, 2001
5.705
+0.107
1.91%
jan 1, 2002
4.217
-1.488
-26.08%
jan 1, 2003
4.389
+0.172
4.08%
jan 1, 2004
4.386
-0.003
-0.08%
jan 1, 2005
4.094
-0.292
-6.66%
jan 1, 2006
3.925
-0.169
-4.13%
jan 1, 2007
4.143
+0.218
5.57%
jan 1, 2008
4.431
+0.288
6.94%
jan 1, 2009
4.78
+0.349
7.88%
jan 1, 2010
7.653
+2.873
60.12%
jan 1, 2011
8.497
+0.844
11.02%
jan 1, 2012
7.892
-0.604
-7.11%
jan 1, 2013
7.258
-0.635
-8.04%
jan 1, 2014
9.821
+2.563
35.32%
jan 1, 2015
7.832
-1.989
-20.25%
jan 1, 2016
6.737
-1.095
-13.98%
Ranking of countries by current statistics by years


Comments: