29
/
en
AIzaSyAYiBZKx7MnpbEhh9jyipgxe19OcubqV5w
April 1, 2024
189047
Maldives
MDV
true
2
1
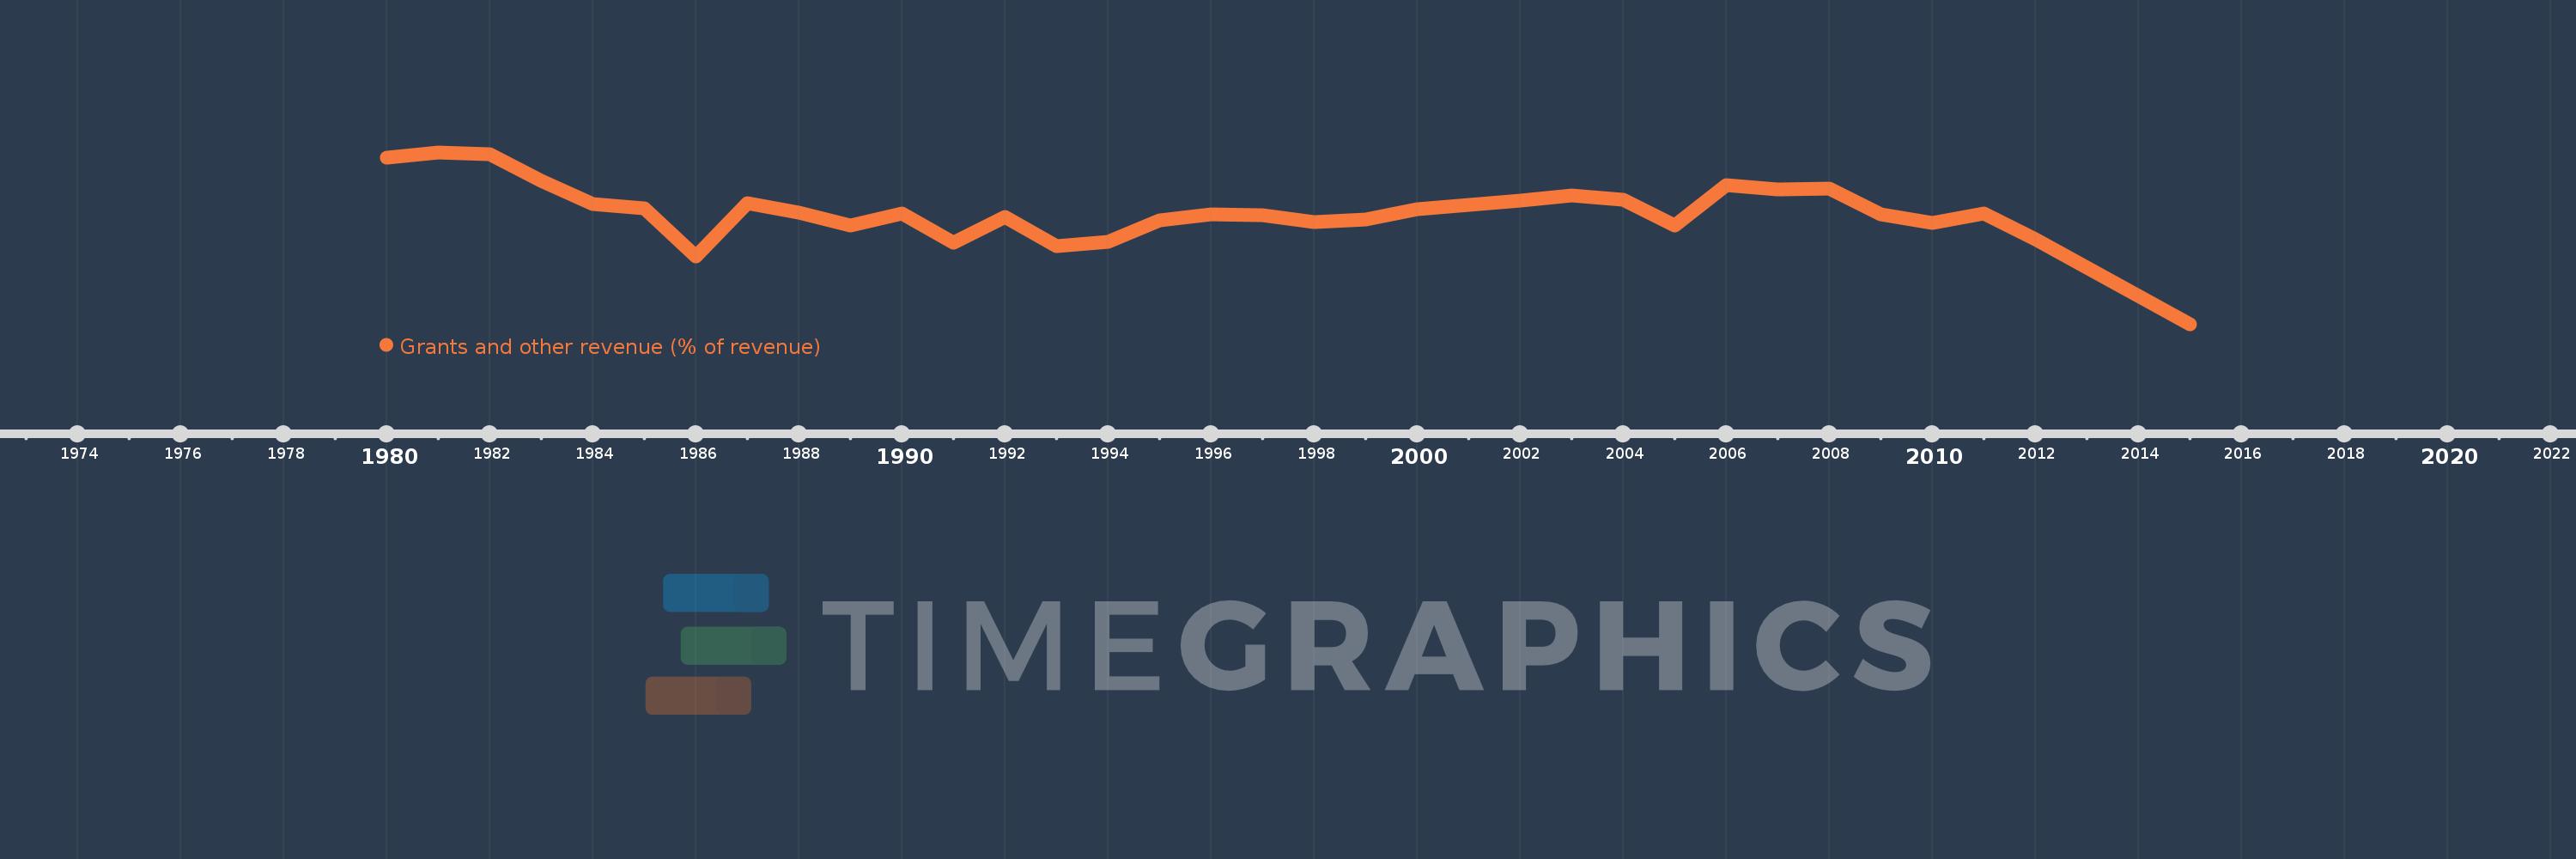
Grants and other revenue (% of revenue)
2015,2012,2011,2010,2009,2008,2007,2006,2005,2004,2003,2002,2001,2000,1999,1998,1997,1996,1995,1994,1993,1992,1991,1990,1989,1988,1987,1986,1985,1984,1983,1982,1981,1980
This statistics in other country:
AfghanistanAlbaniaAlgeriaAngolaAntigua and BarbudaArab WorldArgentinaArmeniaAustraliaAustriaAzerbaijanBahamas, TheBahrainBangladeshBarbadosBelarusBelgiumBelizeBeninBhutanBoliviaBosnia and HerzegovinaBotswanaBrazilBulgariaBurkina FasoBurundiCabo VerdeCambodiaCanadaCaribbean small statesCentral African RepublicCentral Europe and the BalticsChileChinaColombiaCongo, Dem. Rep.Congo, Rep.Costa RicaCote d'IvoireCroatiaCyprusCzech RepublicDenmarkDominicaDominican RepublicEarly-demographic dividendEast Asia & PacificEast Asia & Pacific (excluding high income)East Asia & Pacific (IDA & IBRD countries)Egypt, Arab Rep.El SalvadorEquatorial GuineaEstoniaEthiopiaEuro areaEurope & Central AsiaEurope & Central Asia (excluding high income)Europe & Central Asia (IDA & IBRD countries)European UnionFijiFinlandFranceGambia, TheGeorgiaGermanyGhanaGreeceGrenadaGuatemalaHeavily indebted poor countries (HIPC)High incomeHondurasHong Kong SAR, ChinaHungaryIBRD onlyIcelandIDA & IBRD totalIDA blendIDA onlyIDA totalIndiaIndonesiaIran, Islamic Rep.IraqIrelandIsraelItalyJamaicaJapanJordanKazakhstanKenyaKiribatiKorea, Rep.KuwaitKyrgyz RepublicLao PDRLate-demographic dividendLatin America & Caribbean Latin America & Caribbean (excluding high income)Latin America & the Caribbean (IDA & IBRD countries)LatviaLeast developed countries: UN classificationLebanonLesothoLiberiaLithuaniaLow & middle incomeLow incomeLower middle incomeLuxembourgMacao SAR, ChinaMacedonia, FYRMadagascarMalawiMalaysiaMaldivesMaliMaltaMauritiusMexicoMicronesia, Fed. Sts.Middle East & North AfricaMiddle East & North Africa (excluding high income)Middle East & North Africa (IDA & IBRD countries)Middle incomeMoldovaMongoliaMoroccoMozambiqueMyanmarNamibiaNepalNetherlandsNew ZealandNicaraguaNigeriaNorth AmericaNorwayOECD membersOmanOther small statesPakistanPanamaPapua New GuineaParaguayPeruPhilippinesPolandPortugalPost-demographic dividendPre-demographic dividendQatarRomaniaRussian FederationRwandaSamoaSan MarinoSao Tome and PrincipeSenegalSerbiaSeychellesSierra LeoneSingaporeSlovak RepublicSloveniaSmall statesSolomon IslandsSouth AfricaSouth AsiaSouth Asia (IDA & IBRD)SpainSri LankaSt. Kitts and NevisSt. LuciaSt. Vincent and the GrenadinesSub-Saharan Africa Sub-Saharan Africa (excluding high income)Sub-Saharan Africa (IDA & IBRD countries)SurinameSwazilandSwedenSwitzerlandSyrian Arab RepublicTajikistanTanzaniaThailandTimor-LesteTogoTrinidad and TobagoTunisiaTurkeyUgandaUkraineUnited Arab EmiratesUnited KingdomUnited StatesUpper middle incomeUruguayVanuatuVenezuela, RBVietnamWest Bank and GazaWorldYemen, Rep.ZambiaZimbabwe Timeline:
This timeline shows a graph from 1980 to 2015 of Maldives. No data until 1979. Number of actual observations by date: 34.
Source name:
World Development Indicators
Source organization:
International Monetary Fund, Government Finance Statistics Yearbook and data files.
Categories, topics:
Public Sector
Last updated:
apr 23, 2017
Indicators value changes by year
Minimum:
24.964
jan 1, 2015
Maximum:
71.228
jan 1, 1981
At the date of observation
Value
Absolute change
Change from previous value
jan 1, 1980
69.874
+69.874
0.0%
jan 1, 1981
71.228
+1.354
1.94%
jan 1, 1982
70.802
-0.426
-0.6%
jan 1, 1983
63.605
-7.197
-10.17%
jan 1, 1984
57.403
-6.202
-9.75%
jan 1, 1985
56.269
-1.134
-1.97%
jan 1, 1986
43.199
-13.07
-23.23%
jan 1, 1987
57.457
+14.258
33.01%
jan 1, 1988
55.107
-2.351
-4.09%
jan 1, 1989
51.462
-3.645
-6.61%
jan 1, 1990
54.673
+3.211
6.24%
jan 1, 1991
46.869
-7.804
-14.27%
jan 1, 1992
53.873
+7.004
14.94%
jan 1, 1993
46.015
-7.859
-14.59%
jan 1, 1994
47.111
+1.097
2.38%
jan 1, 1995
53.042
+5.931
12.59%
jan 1, 1996
54.555
+1.513
2.85%
jan 1, 1997
54.42
-0.135
-0.25%
jan 1, 1998
52.527
-1.893
-3.48%
jan 1, 1999
53.182
+0.655
1.25%
jan 1, 2000
56.003
+2.821
5.31%
jan 1, 2001
57.197
+1.193
2.13%
jan 1, 2002
58.236
+1.04
1.82%
jan 1, 2003
59.722
+1.486
2.55%
jan 1, 2004
58.545
-1.177
-1.97%
jan 1, 2005
51.61
-6.935
-11.85%
jan 1, 2006
62.367
+10.757
20.84%
jan 1, 2007
61.171
-1.196
-1.92%
jan 1, 2008
61.444
+0.273
0.45%
jan 1, 2009
54.59
-6.854
-11.15%
jan 1, 2010
52.245
-2.345
-4.29%
jan 1, 2011
54.889
+2.644
5.06%
jan 1, 2012
47.781
-7.108
-12.95%
jan 1, 2015
24.964
-22.817
-47.75%
Ranking of countries by current statistics by years


Comments: