29
/
en
AIzaSyAYiBZKx7MnpbEhh9jyipgxe19OcubqV5w
April 1, 2024
30497
Europe & Central Asia
ECS
false
2
1
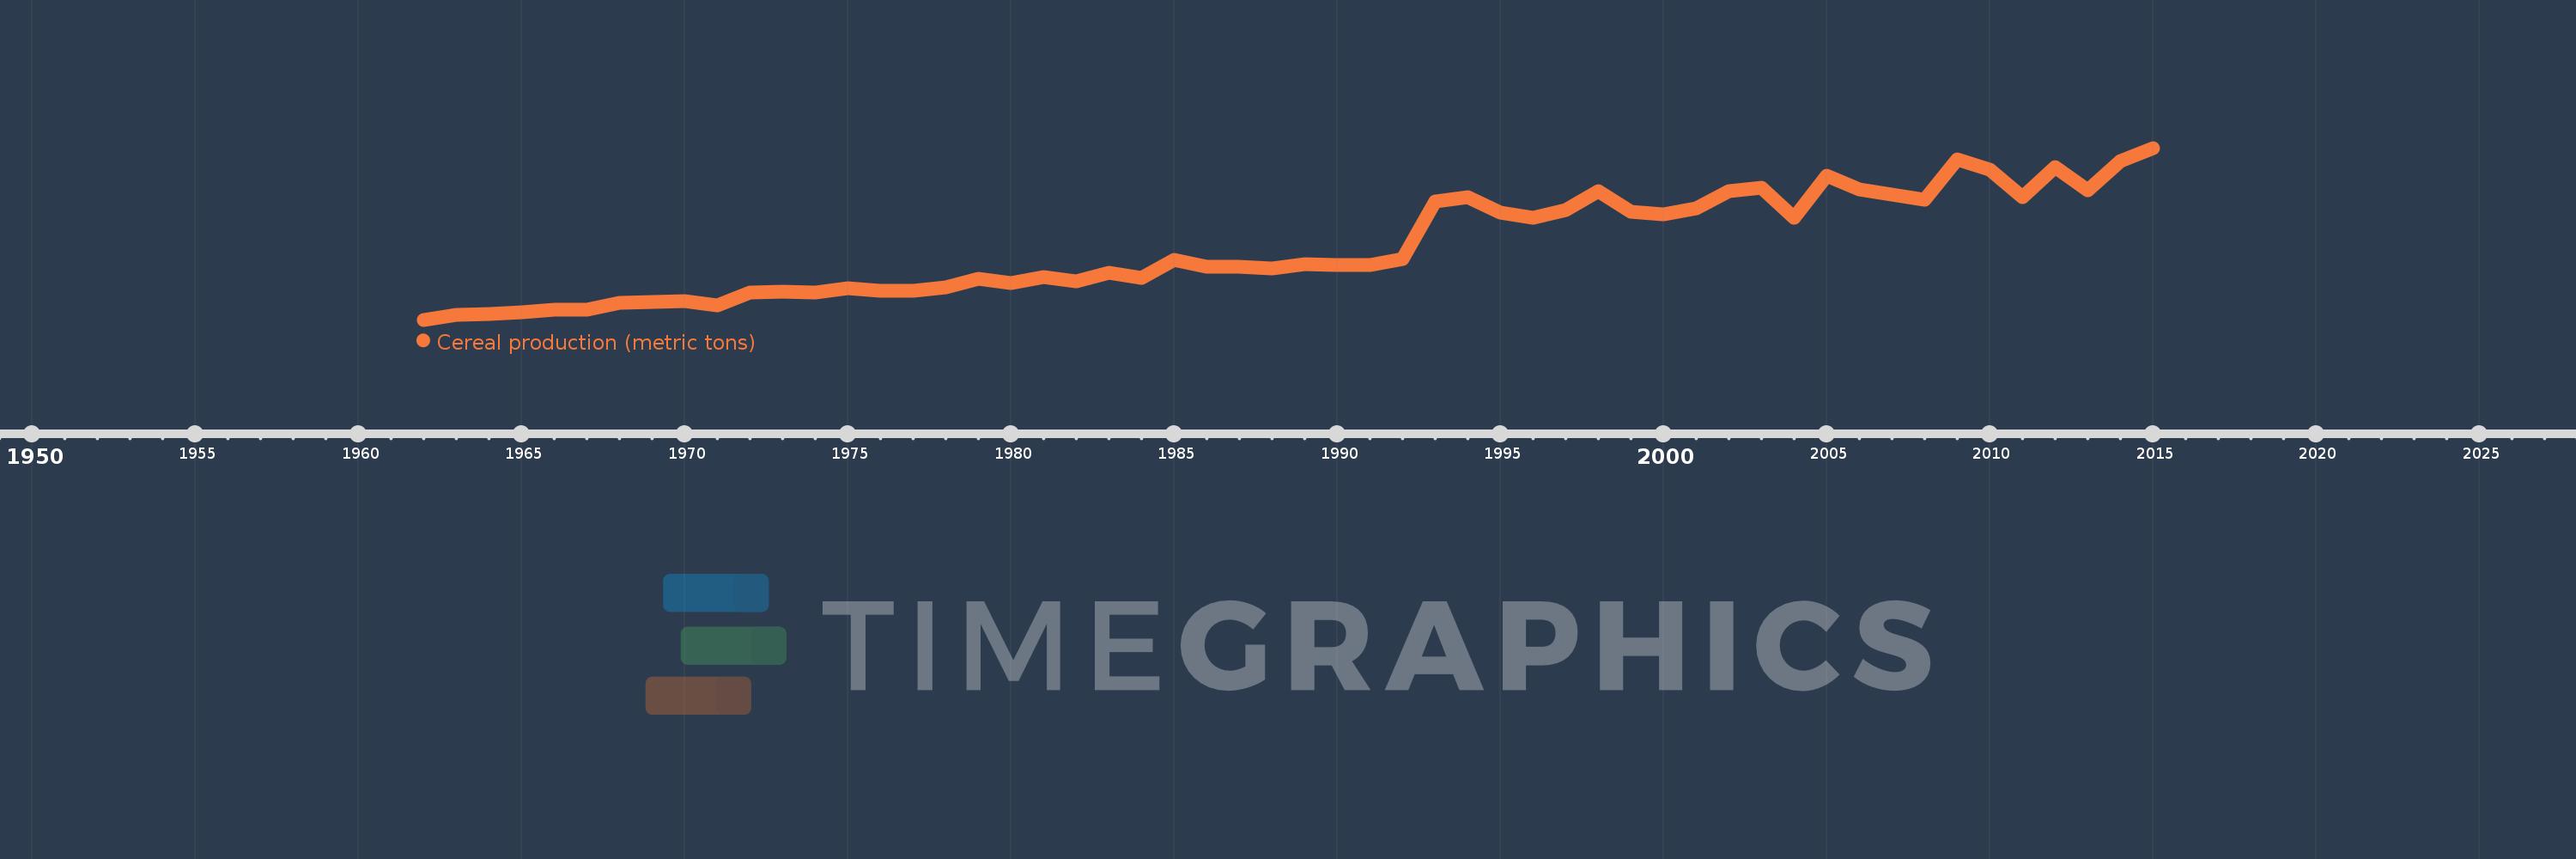
Cereal production (metric tons)
2015,2014,2013,2012,2011,2010,2009,2008,2007,2006,2005,2004,2003,2002,2001,2000,1999,1998,1997,1996,1995,1994,1993,1992,1991,1990,1989,1988,1987,1986,1985,1984,1983,1982,1981,1980,1979,1978,1977,1976,1975,1974,1973,1972,1971,1970,1969,1968,1967,1966,1965,1964,1963,1962
This statistics in other country:
AfghanistanAlbaniaAlgeriaAngolaAntigua and BarbudaArab WorldArgentinaArmeniaAustraliaAustriaAzerbaijanBahamas, TheBangladeshBarbadosBelarusBelgiumBelizeBeninBhutanBoliviaBosnia and HerzegovinaBotswanaBrazilBrunei DarussalamBulgariaBurkina FasoBurundiCabo VerdeCambodiaCameroonCanadaCaribbean small statesCentral African RepublicCentral Europe and the BalticsChadChileChinaColombiaComorosCongo, Dem. Rep.Congo, Rep.Costa RicaCote d'IvoireCroatiaCubaCyprusCzech RepublicDenmarkDjiboutiDominicaDominican RepublicEarly-demographic dividendEast Asia & PacificEast Asia & Pacific (excluding high income)East Asia & Pacific (IDA & IBRD countries)EcuadorEgypt, Arab Rep.El SalvadorEritreaEstoniaEthiopiaEuro areaEurope & Central AsiaEurope & Central Asia (excluding high income)Europe & Central Asia (IDA & IBRD countries)European UnionFijiFinlandFragile and conflict affected situationsFranceGabonGambia, TheGeorgiaGermanyGhanaGreeceGrenadaGuamGuatemalaGuineaGuinea-BissauGuyanaHaitiHeavily indebted poor countries (HIPC)High incomeHondurasHong Kong SAR, ChinaHungaryIBRD onlyIDA & IBRD totalIDA blendIDA onlyIDA totalIndiaIndonesiaIran, Islamic Rep.IraqIrelandIsraelItalyJamaicaJapanJordanKazakhstanKenyaKorea, Dem. People’s Rep.Korea, Rep.KuwaitKyrgyz RepublicLao PDRLate-demographic dividendLatin America & Caribbean Latin America & Caribbean (excluding high income)Latin America & the Caribbean (IDA & IBRD countries)LatviaLeast developed countries: UN classificationLebanonLesothoLiberiaLibyaLithuaniaLow & middle incomeLow incomeLower middle incomeLuxembourgMacedonia, FYRMadagascarMalawiMalaysiaMaldivesMaliMaltaMauritaniaMauritiusMexicoMicronesia, Fed. Sts.Middle East & North AfricaMiddle East & North Africa (excluding high income)Middle East & North Africa (IDA & IBRD countries)Middle incomeMoldovaMongoliaMontenegroMoroccoMozambiqueMyanmarNamibiaNepalNetherlandsNew CaledoniaNew ZealandNicaraguaNigerNigeriaNorth AmericaNorwayOECD membersOmanOther small statesPacific island small statesPakistanPanamaPapua New GuineaParaguayPeruPhilippinesPolandPortugalPost-demographic dividendPre-demographic dividendPuerto RicoQatarRomaniaRussian FederationRwandaSao Tome and PrincipeSaudi ArabiaSenegalSerbiaSierra LeoneSlovak RepublicSloveniaSmall statesSolomon IslandsSomaliaSouth AfricaSouth AsiaSouth Asia (IDA & IBRD)South SudanSpainSri LankaSt. LuciaSt. Vincent and the GrenadinesSub-Saharan Africa Sub-Saharan Africa (excluding high income)Sub-Saharan Africa (IDA & IBRD countries)SudanSurinameSwazilandSwedenSwitzerlandSyrian Arab RepublicTajikistanTanzaniaThailandTimor-LesteTogoTrinidad and TobagoTunisiaTurkeyTurkmenistanUgandaUkraineUnited Arab EmiratesUnited KingdomUnited StatesUpper middle incomeUruguayUzbekistanVanuatuVenezuela, RBVietnamWest Bank and GazaWorldYemen, Rep.ZambiaZimbabwe Timeline:
This timeline shows a graph from 1962 to 2015 of Europe & Central Asia. No data until 1961. Number of actual observations by date: 54.
Source name:
World Development Indicators
Source organization:
Food and Agriculture Organization, electronic files and web site.
Categories, topics:
Agriculture & Rural Development
Last updated:
apr 23, 2017
Indicators value changes by year
Minimum:
141.125 mln
jan 1, 1962
Maximum:
593.709 mln
jan 1, 2015
At the date of observation
Value
Absolute change
Change from previous value
jan 1, 1962
141.125 mln
+141.125 mln
0.0%
jan 1, 1963
154.338 mln
+13.212 mln
9.36%
jan 1, 1964
156.237 mln
+1.899 mln
1.23%
jan 1, 1965
159.902 mln
+3.665 mln
2.35%
jan 1, 1966
167.32 mln
+7.418 mln
4.64%
jan 1, 1967
168.131 mln
+810.919K
0.48%
jan 1, 1968
185.566 mln
+17.435 mln
10.37%
jan 1, 1969
187.289 mln
+1.723 mln
0.93%
jan 1, 1970
190.412 mln
+3.124 mln
1.67%
jan 1, 1971
179.24 mln
-11.172 mln
-5.87%
jan 1, 1972
212.855 mln
+33.615 mln
18.75%
jan 1, 1973
216.17 mln
+3.315 mln
1.56%
jan 1, 1974
213.615 mln
-2.555 mln
-1.18%
jan 1, 1975
223.939 mln
+10.324 mln
4.83%
jan 1, 1976
216.598 mln
-7.341 mln
-3.28%
jan 1, 1977
217.797 mln
+1.198 mln
0.55%
jan 1, 1978
226.668 mln
+8.872 mln
4.07%
jan 1, 1979
248.0 mln
+21.331 mln
9.41%
jan 1, 1980
238.645 mln
-9.354 mln
-3.77%
jan 1, 1981
254.164 mln
+15.518 mln
6.5%
jan 1, 1982
242.755 mln
-11.409 mln
-4.49%
jan 1, 1983
265.275 mln
+22.521 mln
9.28%
jan 1, 1984
251.473 mln
-13.802 mln
-5.2%
jan 1, 1985
299.046 mln
+47.573 mln
18.92%
jan 1, 1986
279.997 mln
-19.05 mln
-6.37%
jan 1, 1987
280.021 mln
+24.759K
0.01%
jan 1, 1988
275.762 mln
-4.259 mln
-1.52%
jan 1, 1989
287.617 mln
+11.855 mln
4.3%
jan 1, 1990
285.647 mln
-1.971 mln
-0.69%
jan 1, 1991
286.166 mln
+519.312K
0.18%
jan 1, 1992
301.457 mln
+15.291 mln
5.34%
jan 1, 1993
453.448 mln
+151.991 mln
50.42%
jan 1, 1994
463.613 mln
+10.165 mln
2.24%
jan 1, 1995
423.39 mln
-40.223 mln
-8.68%
jan 1, 1996
409.721 mln
-13.669 mln
-3.23%
jan 1, 1997
429.807 mln
+20.086 mln
4.9%
jan 1, 1998
479.886 mln
+50.079 mln
11.65%
jan 1, 1999
424.668 mln
-55.219 mln
-11.51%
jan 1, 2000
418.563 mln
-6.105 mln
-1.44%
jan 1, 2001
433.602 mln
+15.039 mln
3.59%
jan 1, 2002
479.435 mln
+45.832 mln
10.57%
jan 1, 2003
489.024 mln
+9.59 mln
2.0%
jan 1, 2004
410.141 mln
-78.883 mln
-16.13%
jan 1, 2005
521.577 mln
+111.436 mln
27.17%
jan 1, 2006
483.975 mln
-37.602 mln
-7.21%
jan 1, 2007
469.923 mln
-14.052 mln
-2.9%
jan 1, 2008
456.23 mln
-13.693 mln
-2.91%
jan 1, 2009
564.282 mln
+108.052 mln
23.68%
jan 1, 2010
536.703 mln
-27.579 mln
-4.89%
jan 1, 2011
463.888 mln
-72.815 mln
-13.57%
jan 1, 2012
543.314 mln
+79.425 mln
17.12%
jan 1, 2013
481.317 mln
-61.996 mln
-11.41%
jan 1, 2014
559.054 mln
+77.737 mln
16.15%
jan 1, 2015
593.709 mln
+34.655 mln
6.2%
Ranking of countries by current statistics by years


Comments: