29
/
en
AIzaSyAYiBZKx7MnpbEhh9jyipgxe19OcubqV5w
April 1, 2024
276427
United States
USA
true
2
1
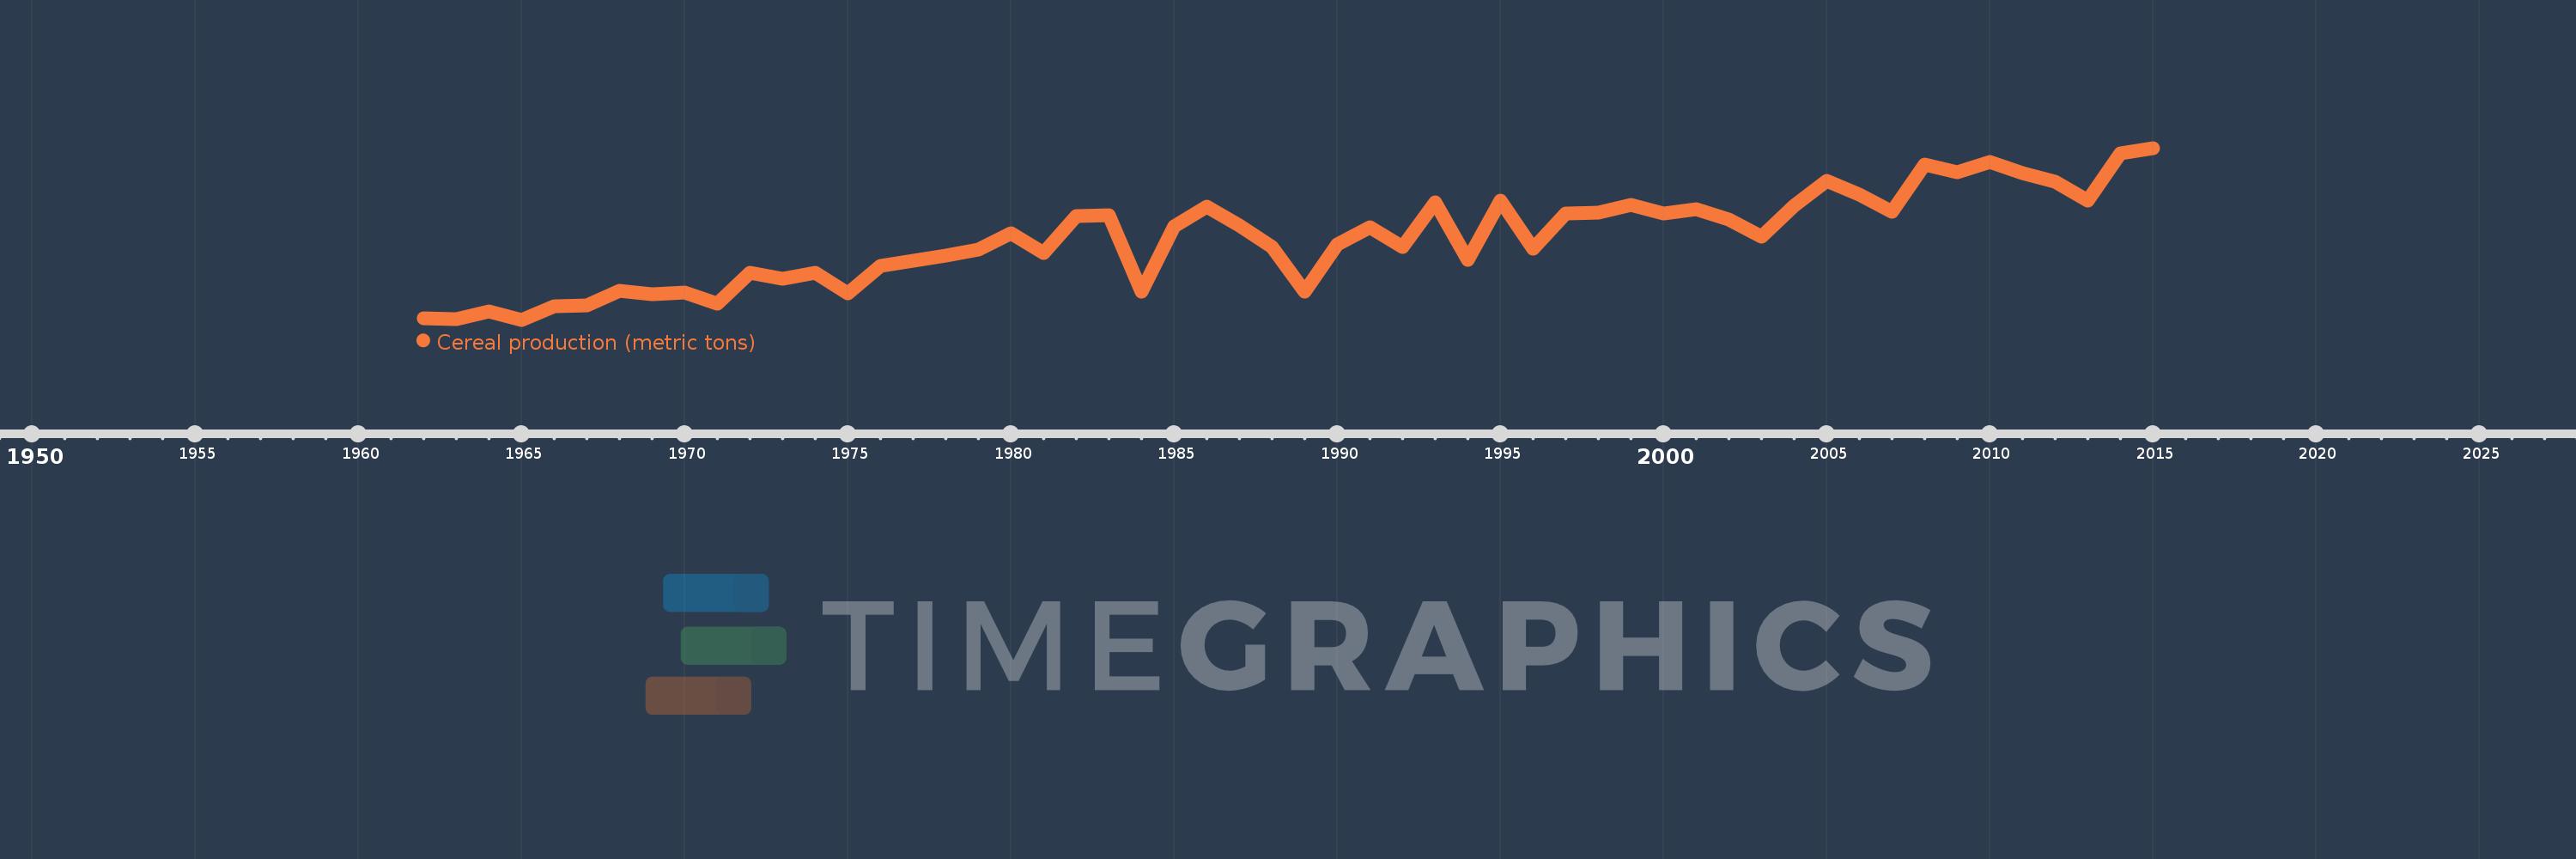
Cereal production (metric tons)
2015,2014,2013,2012,2011,2010,2009,2008,2007,2006,2005,2004,2003,2002,2001,2000,1999,1998,1997,1996,1995,1994,1993,1992,1991,1990,1989,1988,1987,1986,1985,1984,1983,1982,1981,1980,1979,1978,1977,1976,1975,1974,1973,1972,1971,1970,1969,1968,1967,1966,1965,1964,1963,1962
This statistics in other country:
AfghanistanAlbaniaAlgeriaAngolaAntigua and BarbudaArab WorldArgentinaArmeniaAustraliaAustriaAzerbaijanBahamas, TheBangladeshBarbadosBelarusBelgiumBelizeBeninBhutanBoliviaBosnia and HerzegovinaBotswanaBrazilBrunei DarussalamBulgariaBurkina FasoBurundiCabo VerdeCambodiaCameroonCanadaCaribbean small statesCentral African RepublicCentral Europe and the BalticsChadChileChinaColombiaComorosCongo, Dem. Rep.Congo, Rep.Costa RicaCote d'IvoireCroatiaCubaCyprusCzech RepublicDenmarkDjiboutiDominicaDominican RepublicEarly-demographic dividendEast Asia & PacificEast Asia & Pacific (excluding high income)East Asia & Pacific (IDA & IBRD countries)EcuadorEgypt, Arab Rep.El SalvadorEritreaEstoniaEthiopiaEuro areaEurope & Central AsiaEurope & Central Asia (excluding high income)Europe & Central Asia (IDA & IBRD countries)European UnionFijiFinlandFragile and conflict affected situationsFranceGabonGambia, TheGeorgiaGermanyGhanaGreeceGrenadaGuamGuatemalaGuineaGuinea-BissauGuyanaHaitiHeavily indebted poor countries (HIPC)High incomeHondurasHong Kong SAR, ChinaHungaryIBRD onlyIDA & IBRD totalIDA blendIDA onlyIDA totalIndiaIndonesiaIran, Islamic Rep.IraqIrelandIsraelItalyJamaicaJapanJordanKazakhstanKenyaKorea, Dem. People’s Rep.Korea, Rep.KuwaitKyrgyz RepublicLao PDRLate-demographic dividendLatin America & Caribbean Latin America & Caribbean (excluding high income)Latin America & the Caribbean (IDA & IBRD countries)LatviaLeast developed countries: UN classificationLebanonLesothoLiberiaLibyaLithuaniaLow & middle incomeLow incomeLower middle incomeLuxembourgMacedonia, FYRMadagascarMalawiMalaysiaMaldivesMaliMaltaMauritaniaMauritiusMexicoMicronesia, Fed. Sts.Middle East & North AfricaMiddle East & North Africa (excluding high income)Middle East & North Africa (IDA & IBRD countries)Middle incomeMoldovaMongoliaMontenegroMoroccoMozambiqueMyanmarNamibiaNepalNetherlandsNew CaledoniaNew ZealandNicaraguaNigerNigeriaNorth AmericaNorwayOECD membersOmanOther small statesPacific island small statesPakistanPanamaPapua New GuineaParaguayPeruPhilippinesPolandPortugalPost-demographic dividendPre-demographic dividendPuerto RicoQatarRomaniaRussian FederationRwandaSao Tome and PrincipeSaudi ArabiaSenegalSerbiaSierra LeoneSlovak RepublicSloveniaSmall statesSolomon IslandsSomaliaSouth AfricaSouth AsiaSouth Asia (IDA & IBRD)South SudanSpainSri LankaSt. LuciaSt. Vincent and the GrenadinesSub-Saharan Africa Sub-Saharan Africa (excluding high income)Sub-Saharan Africa (IDA & IBRD countries)SudanSurinameSwazilandSwedenSwitzerlandSyrian Arab RepublicTajikistanTanzaniaThailandTimor-LesteTogoTrinidad and TobagoTunisiaTurkeyTurkmenistanUgandaUkraineUnited Arab EmiratesUnited KingdomUnited StatesUpper middle incomeUruguayUzbekistanVanuatuVenezuela, RBVietnamWest Bank and GazaWorldYemen, Rep.ZambiaZimbabwe Timeline:
This timeline shows a graph from 1962 to 2015 of United States. No data until 1961. Number of actual observations by date: 54.
Source name:
World Development Indicators
Source organization:
Food and Agriculture Organization, electronic files and web site.
Categories, topics:
Agriculture & Rural Development
Last updated:
apr 23, 2017
Indicators value changes by year
Minimum:
160.937 mln
jan 1, 1965
Maximum:
442.849 mln
jan 1, 2015
At the date of observation
Value
Absolute change
Change from previous value
jan 1, 1962
163.62 mln
+163.62 mln
0.0%
jan 1, 1963
162.456 mln
-1.164 mln
-0.71%
jan 1, 1964
174.812 mln
+12.357 mln
7.61%
jan 1, 1965
160.937 mln
-13.875 mln
-7.94%
jan 1, 1966
183.603 mln
+22.666 mln
14.08%
jan 1, 1967
184.445 mln
+842.263K
0.46%
jan 1, 1968
208.158 mln
+23.713 mln
12.86%
jan 1, 1969
202.538 mln
-5.62 mln
-2.7%
jan 1, 1970
205.288 mln
+2.75 mln
1.36%
jan 1, 1971
186.861 mln
-18.427 mln
-8.98%
jan 1, 1972
237.624 mln
+50.764 mln
27.17%
jan 1, 1973
228.118 mln
-9.507 mln
-4.0%
jan 1, 1974
237.683 mln
+9.565 mln
4.19%
jan 1, 1975
204.618 mln
-33.066 mln
-13.91%
jan 1, 1976
249.284 mln
+44.666 mln
21.83%
jan 1, 1977
258.2 mln
+8.916 mln
3.58%
jan 1, 1978
266.014 mln
+7.814 mln
3.03%
jan 1, 1979
276.603 mln
+10.588 mln
3.98%
jan 1, 1980
302.626 mln
+26.023 mln
9.41%
jan 1, 1981
269.884 mln
-32.742 mln
-10.82%
jan 1, 1982
330.89 mln
+61.006 mln
22.6%
jan 1, 1983
333.104 mln
+2.214 mln
0.67%
jan 1, 1984
207.658 mln
-125.446 mln
-37.66%
jan 1, 1985
314.75 mln
+107.092 mln
51.57%
jan 1, 1986
347.118 mln
+32.369 mln
10.28%
jan 1, 1987
315.331 mln
-31.787 mln
-9.16%
jan 1, 1988
280.494 mln
-34.837 mln
-11.05%
jan 1, 1989
206.528 mln
-73.966 mln
-26.37%
jan 1, 1990
284.238 mln
+77.71 mln
37.63%
jan 1, 1991
312.411 mln
+28.173 mln
9.91%
jan 1, 1992
280.055 mln
-32.355 mln
-10.36%
jan 1, 1993
353.019 mln
+72.964 mln
26.05%
jan 1, 1994
259.106 mln
-93.913 mln
-26.6%
jan 1, 1995
355.929 mln
+96.823 mln
37.37%
jan 1, 1996
277.6 mln
-78.329 mln
-22.01%
jan 1, 1997
335.79 mln
+58.19 mln
20.96%
jan 1, 1998
336.585 mln
+795.127K
0.24%
jan 1, 1999
349.44 mln
+12.855 mln
3.82%
jan 1, 2000
335.553 mln
-13.887 mln
-3.97%
jan 1, 2001
342.628 mln
+7.075 mln
2.11%
jan 1, 2002
324.992 mln
-17.636 mln
-5.15%
jan 1, 2003
297.144 mln
-27.848 mln
-8.57%
jan 1, 2004
348.246 mln
+51.102 mln
17.2%
jan 1, 2005
389.022 mln
+40.776 mln
11.71%
jan 1, 2006
366.44 mln
-22.583 mln
-5.8%
jan 1, 2007
338.333 mln
-28.107 mln
-7.67%
jan 1, 2008
415.125 mln
+76.793 mln
22.7%
jan 1, 2009
403.541 mln
-11.584 mln
-2.79%
jan 1, 2010
419.376 mln
+15.835 mln
3.92%
jan 1, 2011
401.666 mln
-17.709 mln
-4.22%
jan 1, 2012
386.855 mln
-14.811 mln
-3.69%
jan 1, 2013
356.933 mln
-29.922 mln
-7.73%
jan 1, 2014
434.225 mln
+77.292 mln
21.65%
jan 1, 2015
442.849 mln
+8.625 mln
1.99%
Ranking of countries by current statistics by years


Comments: