29
/
en
AIzaSyAYiBZKx7MnpbEhh9jyipgxe19OcubqV5w
April 1, 2024
245286
South Africa
ZAF
true
2
1
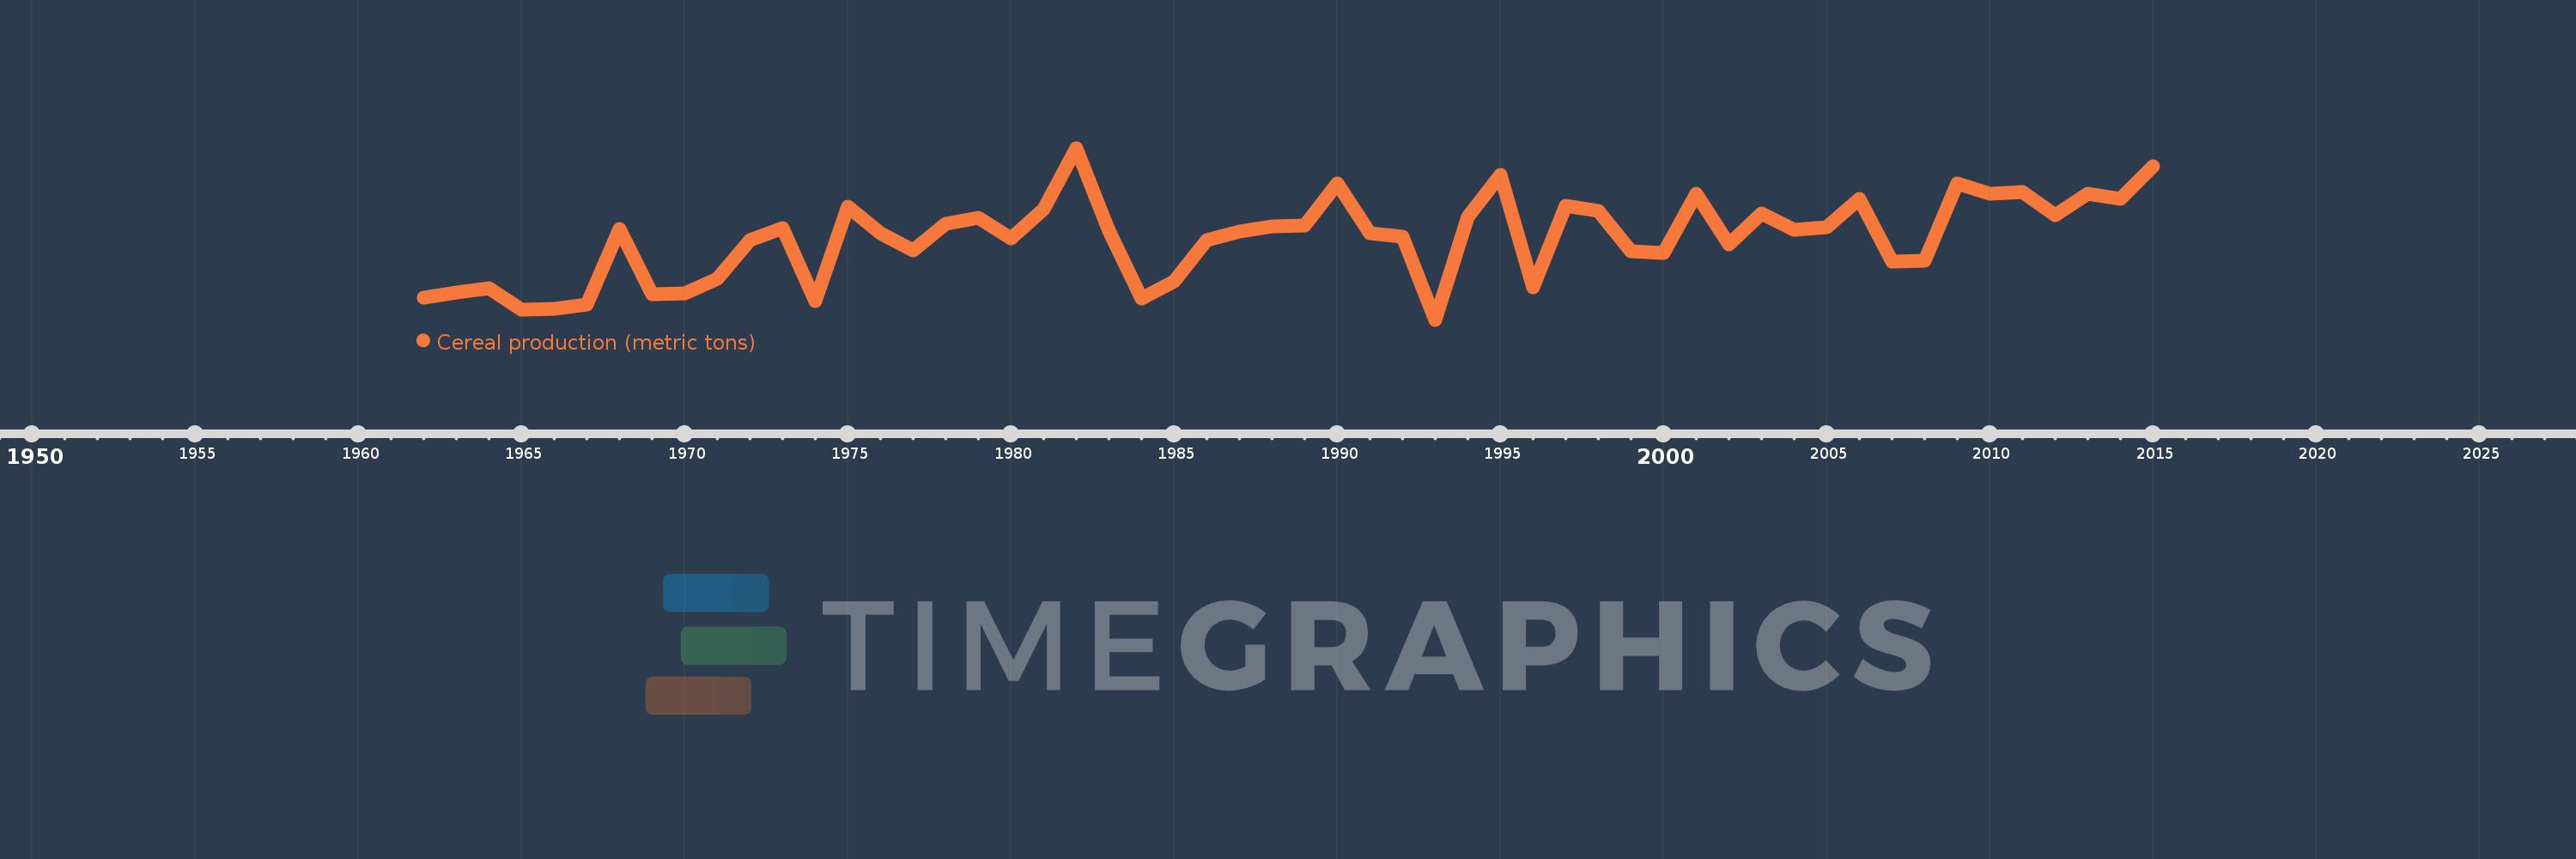
Cereal production (metric tons)
2015,2014,2013,2012,2011,2010,2009,2008,2007,2006,2005,2004,2003,2002,2001,2000,1999,1998,1997,1996,1995,1994,1993,1992,1991,1990,1989,1988,1987,1986,1985,1984,1983,1982,1981,1980,1979,1978,1977,1976,1975,1974,1973,1972,1971,1970,1969,1968,1967,1966,1965,1964,1963,1962
This statistics in other country:
AfghanistanAlbaniaAlgeriaAngolaAntigua and BarbudaArab WorldArgentinaArmeniaAustraliaAustriaAzerbaijanBahamas, TheBangladeshBarbadosBelarusBelgiumBelizeBeninBhutanBoliviaBosnia and HerzegovinaBotswanaBrazilBrunei DarussalamBulgariaBurkina FasoBurundiCabo VerdeCambodiaCameroonCanadaCaribbean small statesCentral African RepublicCentral Europe and the BalticsChadChileChinaColombiaComorosCongo, Dem. Rep.Congo, Rep.Costa RicaCote d'IvoireCroatiaCubaCyprusCzech RepublicDenmarkDjiboutiDominicaDominican RepublicEarly-demographic dividendEast Asia & PacificEast Asia & Pacific (excluding high income)East Asia & Pacific (IDA & IBRD countries)EcuadorEgypt, Arab Rep.El SalvadorEritreaEstoniaEthiopiaEuro areaEurope & Central AsiaEurope & Central Asia (excluding high income)Europe & Central Asia (IDA & IBRD countries)European UnionFijiFinlandFragile and conflict affected situationsFranceGabonGambia, TheGeorgiaGermanyGhanaGreeceGrenadaGuamGuatemalaGuineaGuinea-BissauGuyanaHaitiHeavily indebted poor countries (HIPC)High incomeHondurasHong Kong SAR, ChinaHungaryIBRD onlyIDA & IBRD totalIDA blendIDA onlyIDA totalIndiaIndonesiaIran, Islamic Rep.IraqIrelandIsraelItalyJamaicaJapanJordanKazakhstanKenyaKorea, Dem. People’s Rep.Korea, Rep.KuwaitKyrgyz RepublicLao PDRLate-demographic dividendLatin America & Caribbean Latin America & Caribbean (excluding high income)Latin America & the Caribbean (IDA & IBRD countries)LatviaLeast developed countries: UN classificationLebanonLesothoLiberiaLibyaLithuaniaLow & middle incomeLow incomeLower middle incomeLuxembourgMacedonia, FYRMadagascarMalawiMalaysiaMaldivesMaliMaltaMauritaniaMauritiusMexicoMicronesia, Fed. Sts.Middle East & North AfricaMiddle East & North Africa (excluding high income)Middle East & North Africa (IDA & IBRD countries)Middle incomeMoldovaMongoliaMontenegroMoroccoMozambiqueMyanmarNamibiaNepalNetherlandsNew CaledoniaNew ZealandNicaraguaNigerNigeriaNorth AmericaNorwayOECD membersOmanOther small statesPacific island small statesPakistanPanamaPapua New GuineaParaguayPeruPhilippinesPolandPortugalPost-demographic dividendPre-demographic dividendPuerto RicoQatarRomaniaRussian FederationRwandaSao Tome and PrincipeSaudi ArabiaSenegalSerbiaSierra LeoneSlovak RepublicSloveniaSmall statesSolomon IslandsSomaliaSouth AfricaSouth AsiaSouth Asia (IDA & IBRD)South SudanSpainSri LankaSt. LuciaSt. Vincent and the GrenadinesSub-Saharan Africa Sub-Saharan Africa (excluding high income)Sub-Saharan Africa (IDA & IBRD countries)SudanSurinameSwazilandSwedenSwitzerlandSyrian Arab RepublicTajikistanTanzaniaThailandTimor-LesteTogoTrinidad and TobagoTunisiaTurkeyTurkmenistanUgandaUkraineUnited Arab EmiratesUnited KingdomUnited StatesUpper middle incomeUruguayUzbekistanVanuatuVenezuela, RBVietnamWest Bank and GazaWorldYemen, Rep.ZambiaZimbabwe Timeline:
This timeline shows a graph from 1962 to 2015 of South Africa. No data until 1961. Number of actual observations by date: 54.
Source name:
World Development Indicators
Source organization:
Food and Agriculture Organization, electronic files and web site.
Categories, topics:
Agriculture & Rural Development
Last updated:
apr 23, 2017
Indicators value changes by year
Minimum:
5.052 mln
jan 1, 1993
Maximum:
18.005 mln
jan 1, 1982
At the date of observation
Value
Absolute change
Change from previous value
jan 1, 1962
6.697 mln
+6.697 mln
0.0%
jan 1, 1963
7.089 mln
+392.706K
5.86%
jan 1, 1964
7.459 mln
+369.473K
5.21%
jan 1, 1965
5.839 mln
-1.62 mln
-21.72%
jan 1, 1966
5.844 mln
+5.1K
0.09%
jan 1, 1967
6.184 mln
+339.711K
5.81%
jan 1, 1968
11.868 mln
+5.684 mln
91.92%
jan 1, 1969
7.003 mln
-4.864 mln
-40.99%
jan 1, 1970
7.051 mln
+47.291K
0.68%
jan 1, 1971
8.138 mln
+1.087 mln
15.42%
jan 1, 1972
11.028 mln
+2.89 mln
35.51%
jan 1, 1973
11.951 mln
+923.21K
8.37%
jan 1, 1974
6.468 mln
-5.483 mln
-45.88%
jan 1, 1975
13.58 mln
+7.112 mln
109.96%
jan 1, 1976
11.558 mln
-2.022 mln
-14.89%
jan 1, 1977
10.273 mln
-1.285 mln
-11.12%
jan 1, 1978
12.303 mln
+2.03 mln
19.76%
jan 1, 1979
12.755 mln
+452.71K
3.68%
jan 1, 1980
11.202 mln
-1.554 mln
-12.18%
jan 1, 1981
13.378 mln
+2.176 mln
19.43%
jan 1, 1982
18.005 mln
+4.627 mln
34.59%
jan 1, 1983
11.763 mln
-6.242 mln
-34.67%
jan 1, 1984
6.674 mln
-5.089 mln
-43.27%
jan 1, 1985
7.927 mln
+1.254 mln
18.79%
jan 1, 1986
11.062 mln
+3.135 mln
39.54%
jan 1, 1987
11.691 mln
+629.014K
5.69%
jan 1, 1988
12.097 mln
+405.903K
3.47%
jan 1, 1989
12.14 mln
+43.188K
0.36%
jan 1, 1990
15.341 mln
+3.201 mln
26.37%
jan 1, 1991
11.558 mln
-3.783 mln
-24.66%
jan 1, 1992
11.292 mln
-265.902K
-2.3%
jan 1, 1993
5.052 mln
-6.24 mln
-55.26%
jan 1, 1994
12.802 mln
+7.75 mln
153.4%
jan 1, 1995
15.986 mln
+3.183 mln
24.86%
jan 1, 1996
7.514 mln
-8.471 mln
-52.99%
jan 1, 1997
13.668 mln
+6.154 mln
81.89%
jan 1, 1998
13.25 mln
-417.615K
-3.06%
jan 1, 1999
10.221 mln
-3.029 mln
-22.86%
jan 1, 2000
10.061 mln
-159.885K
-1.56%
jan 1, 2001
14.523 mln
+4.462 mln
44.35%
jan 1, 2002
10.705 mln
-3.818 mln
-26.29%
jan 1, 2003
13.044 mln
+2.34 mln
21.86%
jan 1, 2004
11.819 mln
-1.225 mln
-9.39%
jan 1, 2005
12.027 mln
+207.747K
1.76%
jan 1, 2006
14.175 mln
+2.148 mln
17.86%
jan 1, 2007
9.452 mln
-4.723 mln
-33.32%
jan 1, 2008
9.508 mln
+55.562K
0.59%
jan 1, 2009
15.339 mln
+5.832 mln
61.33%
jan 1, 2010
14.571 mln
-768.601K
-5.01%
jan 1, 2011
14.701 mln
+130.164K
0.89%
jan 1, 2012
12.928 mln
-1.773 mln
-12.06%
jan 1, 2013
14.556 mln
+1.628 mln
12.59%
jan 1, 2014
14.155 mln
-401.597K
-2.76%
jan 1, 2015
16.62 mln
+2.465 mln
17.42%
Ranking of countries by current statistics by years


Comments: