29
/
en
AIzaSyAYiBZKx7MnpbEhh9jyipgxe19OcubqV5w
April 1, 2024
274577
United Arab Emirates
ARE
true
2
1
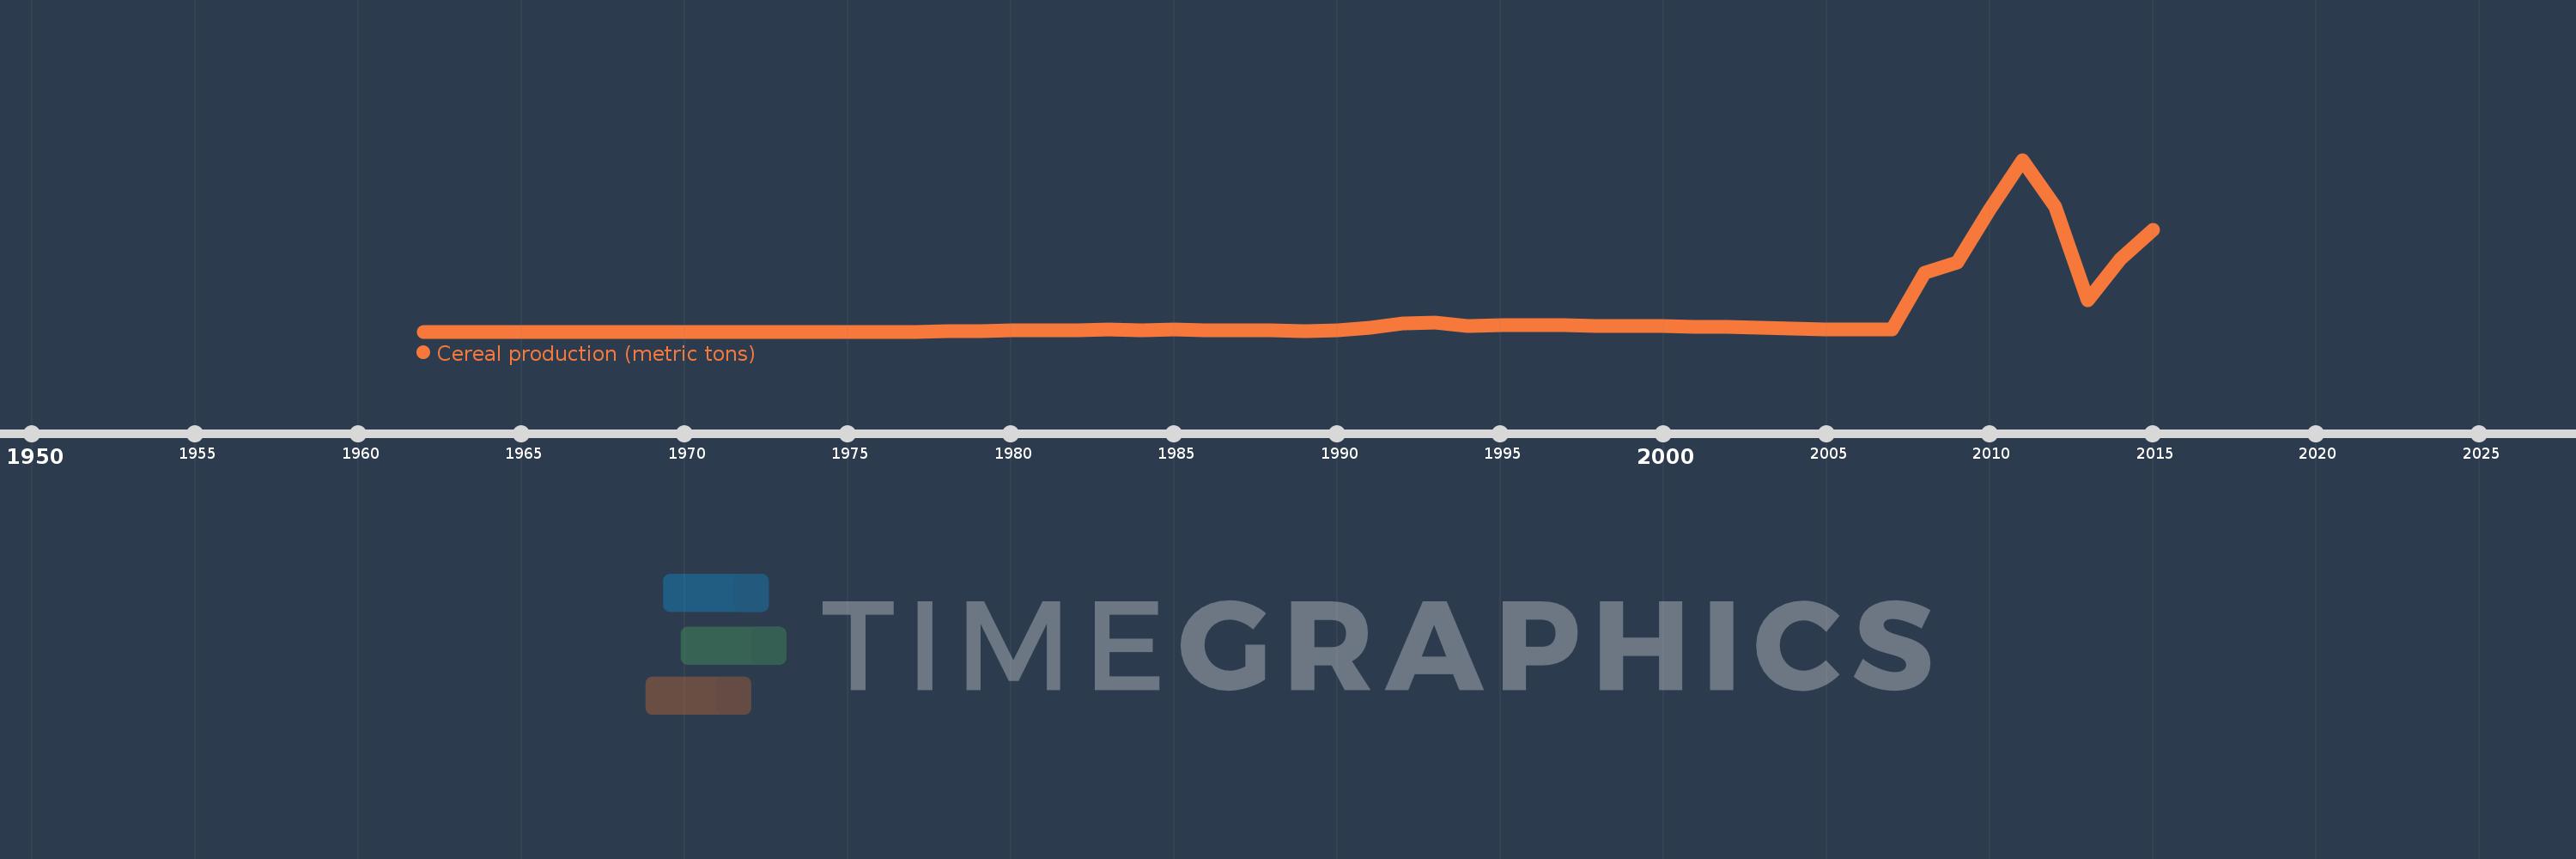
Cereal production (metric tons)
2015,2014,2013,2012,2011,2010,2009,2008,2007,2006,2005,2004,2003,2002,2001,2000,1999,1998,1997,1996,1995,1994,1993,1992,1991,1990,1989,1988,1987,1986,1985,1984,1983,1982,1981,1980,1979,1978,1977,1976,1975,1974,1973,1972,1971,1970,1969,1968,1967,1966,1965,1964,1963,1962
This statistics in other country:
AfghanistanAlbaniaAlgeriaAngolaAntigua and BarbudaArab WorldArgentinaArmeniaAustraliaAustriaAzerbaijanBahamas, TheBangladeshBarbadosBelarusBelgiumBelizeBeninBhutanBoliviaBosnia and HerzegovinaBotswanaBrazilBrunei DarussalamBulgariaBurkina FasoBurundiCabo VerdeCambodiaCameroonCanadaCaribbean small statesCentral African RepublicCentral Europe and the BalticsChadChileChinaColombiaComorosCongo, Dem. Rep.Congo, Rep.Costa RicaCote d'IvoireCroatiaCubaCyprusCzech RepublicDenmarkDjiboutiDominicaDominican RepublicEarly-demographic dividendEast Asia & PacificEast Asia & Pacific (excluding high income)East Asia & Pacific (IDA & IBRD countries)EcuadorEgypt, Arab Rep.El SalvadorEritreaEstoniaEthiopiaEuro areaEurope & Central AsiaEurope & Central Asia (excluding high income)Europe & Central Asia (IDA & IBRD countries)European UnionFijiFinlandFragile and conflict affected situationsFranceGabonGambia, TheGeorgiaGermanyGhanaGreeceGrenadaGuamGuatemalaGuineaGuinea-BissauGuyanaHaitiHeavily indebted poor countries (HIPC)High incomeHondurasHong Kong SAR, ChinaHungaryIBRD onlyIDA & IBRD totalIDA blendIDA onlyIDA totalIndiaIndonesiaIran, Islamic Rep.IraqIrelandIsraelItalyJamaicaJapanJordanKazakhstanKenyaKorea, Dem. People’s Rep.Korea, Rep.KuwaitKyrgyz RepublicLao PDRLate-demographic dividendLatin America & Caribbean Latin America & Caribbean (excluding high income)Latin America & the Caribbean (IDA & IBRD countries)LatviaLeast developed countries: UN classificationLebanonLesothoLiberiaLibyaLithuaniaLow & middle incomeLow incomeLower middle incomeLuxembourgMacedonia, FYRMadagascarMalawiMalaysiaMaldivesMaliMaltaMauritaniaMauritiusMexicoMicronesia, Fed. Sts.Middle East & North AfricaMiddle East & North Africa (excluding high income)Middle East & North Africa (IDA & IBRD countries)Middle incomeMoldovaMongoliaMontenegroMoroccoMozambiqueMyanmarNamibiaNepalNetherlandsNew CaledoniaNew ZealandNicaraguaNigerNigeriaNorth AmericaNorwayOECD membersOmanOther small statesPacific island small statesPakistanPanamaPapua New GuineaParaguayPeruPhilippinesPolandPortugalPost-demographic dividendPre-demographic dividendPuerto RicoQatarRomaniaRussian FederationRwandaSao Tome and PrincipeSaudi ArabiaSenegalSerbiaSierra LeoneSlovak RepublicSloveniaSmall statesSolomon IslandsSomaliaSouth AfricaSouth AsiaSouth Asia (IDA & IBRD)South SudanSpainSri LankaSt. LuciaSt. Vincent and the GrenadinesSub-Saharan Africa Sub-Saharan Africa (excluding high income)Sub-Saharan Africa (IDA & IBRD countries)SudanSurinameSwazilandSwedenSwitzerlandSyrian Arab RepublicTajikistanTanzaniaThailandTimor-LesteTogoTrinidad and TobagoTunisiaTurkeyTurkmenistanUgandaUkraineUnited Arab EmiratesUnited KingdomUnited StatesUpper middle incomeUruguayUzbekistanVanuatuVenezuela, RBVietnamWest Bank and GazaWorldYemen, Rep.ZambiaZimbabwe Timeline:
This timeline shows a graph from 1962 to 2015 of United Arab Emirates. No data until 1961. Number of actual observations by date: 54.
Source name:
World Development Indicators
Source organization:
Food and Agriculture Organization, electronic files and web site.
Categories, topics:
Agriculture & Rural Development
Last updated:
apr 23, 2017
Indicators value changes by year
Maximum:
130.394K
jan 1, 2011
At the date of observation
Value
Absolute change
Change from previous value
jan 1, 1979
242.0
+228.0
1.63K%
jan 1, 1980
785.0
+543.0
224.38%
jan 1, 1981
906.0
+121.0
15.41%
jan 1, 1982
757.0
-149.0
-16.45%
jan 1, 1983
1.78K
+1.023K
135.14%
jan 1, 1984
1.276K
-504.0
-28.31%
jan 1, 1985
1.536K
+260.0
20.38%
jan 1, 1986
1.3K
-236.0
-15.36%
jan 1, 1987
1.175K
-125.0
-9.62%
jan 1, 1988
874.0
-301.0
-25.62%
jan 1, 1989
544.0
-330.0
-37.76%
jan 1, 1990
1.201K
+657.0
120.77%
jan 1, 1991
2.877K
+1.676K
139.55%
jan 1, 1992
6.076K
+3.199K
111.19%
jan 1, 1993
6.95K
+874.0
14.38%
jan 1, 1994
4.562K
-2.388K
-34.36%
jan 1, 1995
4.952K
+390.0
8.55%
jan 1, 1996
4.972K
+20.0
0.4%
jan 1, 1997
4.701K
-271.0
-5.45%
jan 1, 1998
4.498K
-203.0
-4.32%
jan 1, 1999
4.439K
-59.0
-1.31%
jan 1, 2000
4.061K
-378.0
-8.52%
jan 1, 2001
3.873K
-188.0
-4.63%
jan 1, 2002
3.265K
-608.0
-15.7%
jan 1, 2003
2.76K
-505.0
-15.47%
jan 1, 2004
2.193K
-567.0
-20.54%
jan 1, 2005
1.88K
-313.0
-14.27%
jan 1, 2006
1.697K
-183.0
-9.73%
jan 1, 2007
1.687K
-10.0
-0.59%
jan 1, 2008
44.879K
+43.192K
2.56K%
jan 1, 2009
52.697K
+7.818K
17.42%
jan 1, 2010
92.746K
+40.049K
76.0%
jan 1, 2011
130.394K
+37.648K
40.59%
jan 1, 2012
94.877K
-35.517K
-27.24%
jan 1, 2013
23.956K
-70.921K
-74.75%
jan 1, 2014
54.856K
+30.9K
128.99%
jan 1, 2015
77.464K
+22.608K
41.21%
Ranking of countries by current statistics by years


Comments: