29
/
en
AIzaSyAYiBZKx7MnpbEhh9jyipgxe19OcubqV5w
April 1, 2024
103339
Chad
TCD
true
2
1
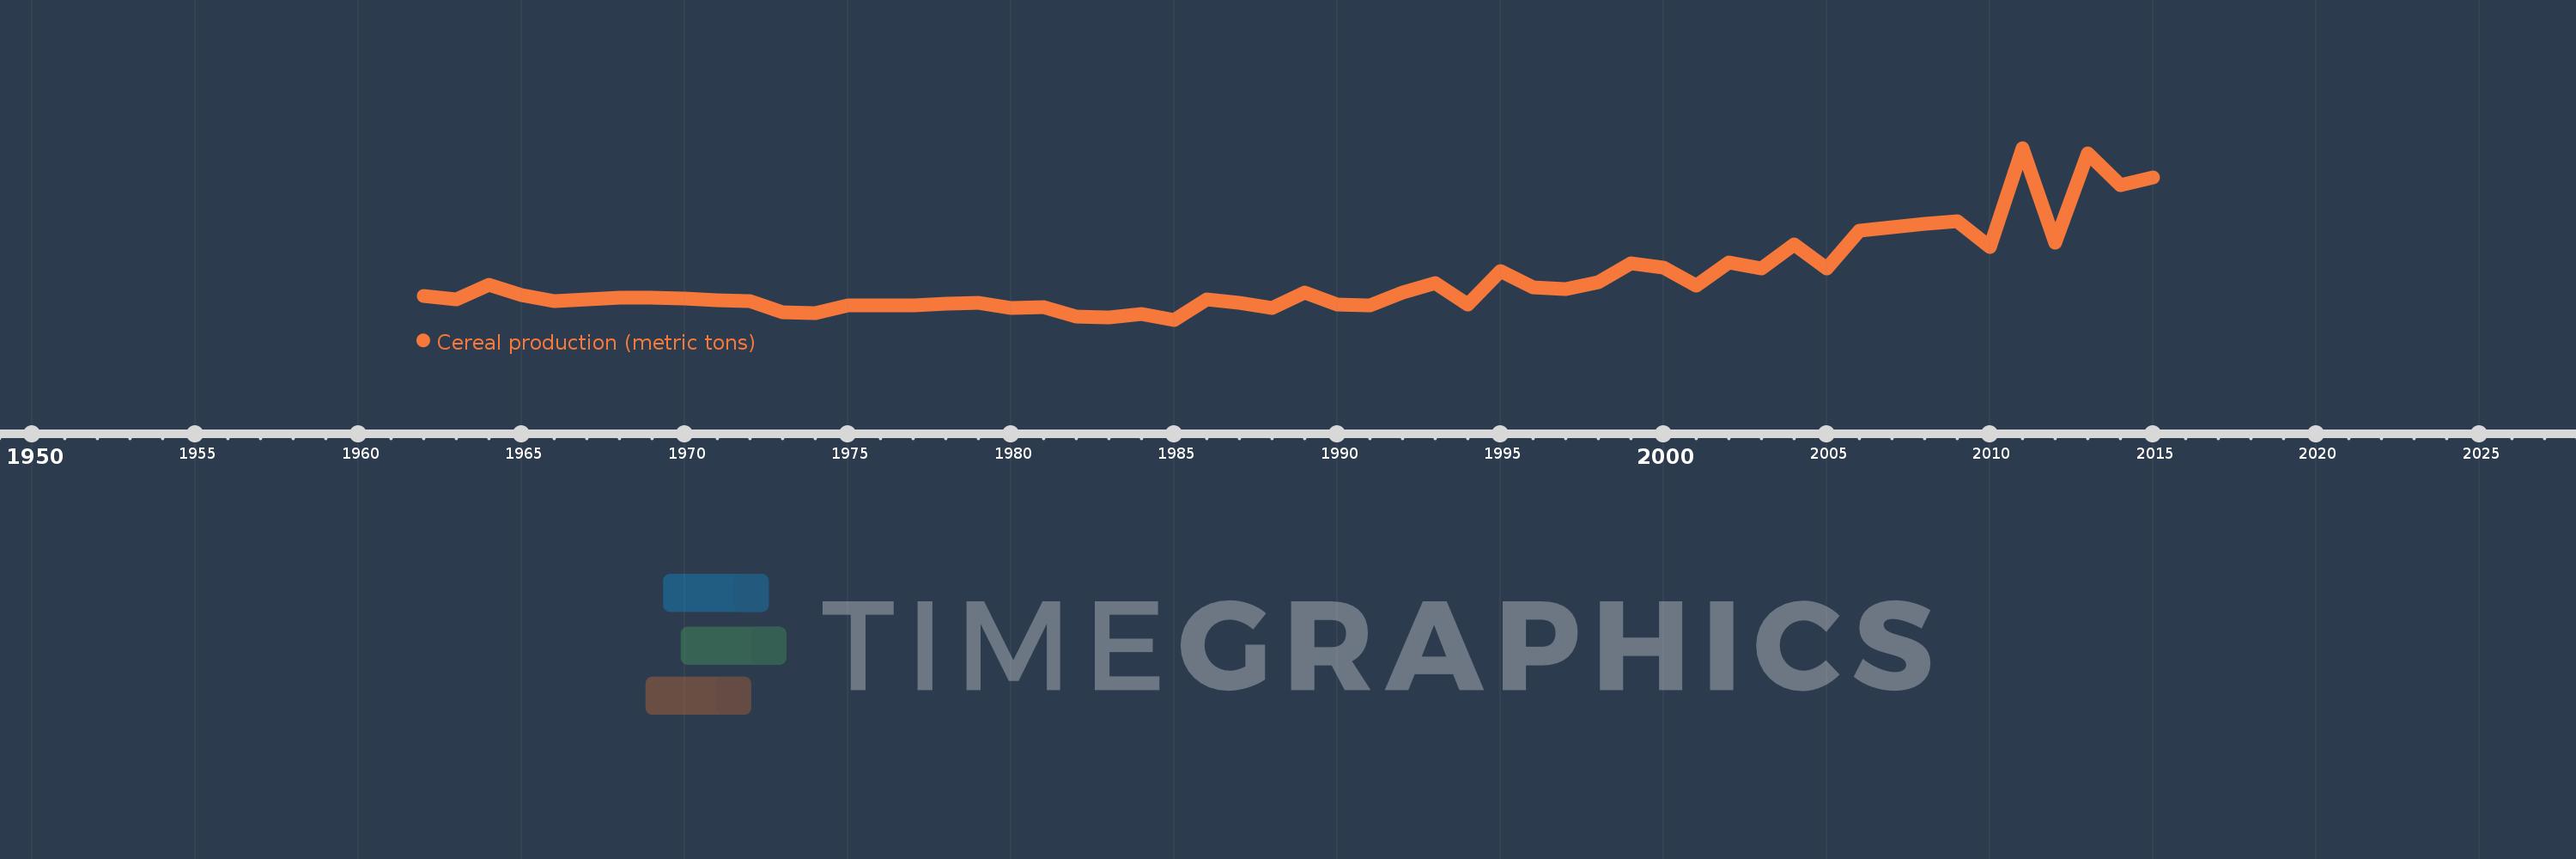
Cereal production (metric tons)
2015,2014,2013,2012,2011,2010,2009,2008,2007,2006,2005,2004,2003,2002,2001,2000,1999,1998,1997,1996,1995,1994,1993,1992,1991,1990,1989,1988,1987,1986,1985,1984,1983,1982,1981,1980,1979,1978,1977,1976,1975,1974,1973,1972,1971,1970,1969,1968,1967,1966,1965,1964,1963,1962
This statistics in other country:
AfghanistanAlbaniaAlgeriaAngolaAntigua and BarbudaArab WorldArgentinaArmeniaAustraliaAustriaAzerbaijanBahamas, TheBangladeshBarbadosBelarusBelgiumBelizeBeninBhutanBoliviaBosnia and HerzegovinaBotswanaBrazilBrunei DarussalamBulgariaBurkina FasoBurundiCabo VerdeCambodiaCameroonCanadaCaribbean small statesCentral African RepublicCentral Europe and the BalticsChadChileChinaColombiaComorosCongo, Dem. Rep.Congo, Rep.Costa RicaCote d'IvoireCroatiaCubaCyprusCzech RepublicDenmarkDjiboutiDominicaDominican RepublicEarly-demographic dividendEast Asia & PacificEast Asia & Pacific (excluding high income)East Asia & Pacific (IDA & IBRD countries)EcuadorEgypt, Arab Rep.El SalvadorEritreaEstoniaEthiopiaEuro areaEurope & Central AsiaEurope & Central Asia (excluding high income)Europe & Central Asia (IDA & IBRD countries)European UnionFijiFinlandFragile and conflict affected situationsFranceGabonGambia, TheGeorgiaGermanyGhanaGreeceGrenadaGuamGuatemalaGuineaGuinea-BissauGuyanaHaitiHeavily indebted poor countries (HIPC)High incomeHondurasHong Kong SAR, ChinaHungaryIBRD onlyIDA & IBRD totalIDA blendIDA onlyIDA totalIndiaIndonesiaIran, Islamic Rep.IraqIrelandIsraelItalyJamaicaJapanJordanKazakhstanKenyaKorea, Dem. People’s Rep.Korea, Rep.KuwaitKyrgyz RepublicLao PDRLate-demographic dividendLatin America & Caribbean Latin America & Caribbean (excluding high income)Latin America & the Caribbean (IDA & IBRD countries)LatviaLeast developed countries: UN classificationLebanonLesothoLiberiaLibyaLithuaniaLow & middle incomeLow incomeLower middle incomeLuxembourgMacedonia, FYRMadagascarMalawiMalaysiaMaldivesMaliMaltaMauritaniaMauritiusMexicoMicronesia, Fed. Sts.Middle East & North AfricaMiddle East & North Africa (excluding high income)Middle East & North Africa (IDA & IBRD countries)Middle incomeMoldovaMongoliaMontenegroMoroccoMozambiqueMyanmarNamibiaNepalNetherlandsNew CaledoniaNew ZealandNicaraguaNigerNigeriaNorth AmericaNorwayOECD membersOmanOther small statesPacific island small statesPakistanPanamaPapua New GuineaParaguayPeruPhilippinesPolandPortugalPost-demographic dividendPre-demographic dividendPuerto RicoQatarRomaniaRussian FederationRwandaSao Tome and PrincipeSaudi ArabiaSenegalSerbiaSierra LeoneSlovak RepublicSloveniaSmall statesSolomon IslandsSomaliaSouth AfricaSouth AsiaSouth Asia (IDA & IBRD)South SudanSpainSri LankaSt. LuciaSt. Vincent and the GrenadinesSub-Saharan Africa Sub-Saharan Africa (excluding high income)Sub-Saharan Africa (IDA & IBRD countries)SudanSurinameSwazilandSwedenSwitzerlandSyrian Arab RepublicTajikistanTanzaniaThailandTimor-LesteTogoTrinidad and TobagoTunisiaTurkeyTurkmenistanUgandaUkraineUnited Arab EmiratesUnited KingdomUnited StatesUpper middle incomeUruguayUzbekistanVanuatuVenezuela, RBVietnamWest Bank and GazaWorldYemen, Rep.ZambiaZimbabwe Timeline:
This timeline shows a graph from 1962 to 2015 of Chad. No data until 1961. Number of actual observations by date: 54.
Source name:
World Development Indicators
Source organization:
Food and Agriculture Organization, electronic files and web site.
Categories, topics:
Agriculture & Rural Development
Last updated:
apr 23, 2017
Indicators value changes by year
Minimum:
354.966K
jan 1, 1985
Maximum:
3.248 mln
jan 1, 2011
At the date of observation
Value
Absolute change
Change from previous value
jan 1, 1962
755.6K
+755.6K
0.0%
jan 1, 1963
695.1K
-60.5K
-8.01%
jan 1, 1964
950.0K
+254.9K
36.67%
jan 1, 1965
770.1K
-179.9K
-18.94%
jan 1, 1966
664.0K
-106.1K
-13.78%
jan 1, 1967
703.855K
+39.855K
6.0%
jan 1, 1968
725.205K
+21.35K
3.03%
jan 1, 1969
721.4K
-3.805K
-0.52%
jan 1, 1970
715.35K
-6.05K
-0.84%
jan 1, 1971
676.354K
-38.996K
-5.45%
jan 1, 1972
663.885K
-12.469K
-1.84%
jan 1, 1973
485.01K
-178.875K
-26.94%
jan 1, 1974
468.0K
-17.01K
-3.51%
jan 1, 1975
593.83K
+125.83K
26.89%
jan 1, 1976
590.95K
-2.88K
-0.48%
jan 1, 1977
590.0K
-950.0
-0.16%
jan 1, 1978
619.5K
+29.5K
5.0%
jan 1, 1979
640.7K
+21.2K
3.42%
jan 1, 1980
549.7K
-91.0K
-14.2%
jan 1, 1981
572.8K
+23.1K
4.2%
jan 1, 1982
401.4K
-171.4K
-29.92%
jan 1, 1983
392.9K
-8.5K
-2.12%
jan 1, 1984
449.729K
+56.829K
14.46%
jan 1, 1985
354.966K
-94.763K
-21.07%
jan 1, 1986
704.919K
+349.953K
98.59%
jan 1, 1987
634.644K
-70.275K
-9.97%
jan 1, 1988
548.556K
-86.088K
-13.56%
jan 1, 1989
808.086K
+259.53K
47.31%
jan 1, 1990
616.841K
-191.245K
-23.67%
jan 1, 1991
601.39K
-15.451K
-2.5%
jan 1, 1992
812.0K
+210.61K
35.02%
jan 1, 1993
976.31K
+164.31K
20.24%
jan 1, 1994
617.078K
-359.232K
-36.79%
jan 1, 1995
1.175 mln
+557.791K
90.39%
jan 1, 1996
907.316K
-267.553K
-22.77%
jan 1, 1997
877.738K
-29.578K
-3.26%
jan 1, 1998
985.833K
+108.095K
12.32%
jan 1, 1999
1.312 mln
+326.318K
33.1%
jan 1, 2000
1.231 mln
-81.353K
-6.2%
jan 1, 2001
930.038K
-300.76K
-24.44%
jan 1, 2002
1.321 mln
+391.256K
42.07%
jan 1, 2003
1.212 mln
-108.904K
-8.24%
jan 1, 2004
1.618 mln
+405.749K
33.47%
jan 1, 2005
1.213 mln
-405.235K
-25.04%
jan 1, 2006
1.853 mln
+640.492K
52.81%
jan 1, 2007
1.913 mln
+59.915K
3.23%
jan 1, 2008
1.972 mln
+58.725K
3.07%
jan 1, 2009
2.019 mln
+46.613K
2.36%
jan 1, 2010
1.581 mln
-437.502K
-21.67%
jan 1, 2011
3.248 mln
+1.666 mln
105.39%
jan 1, 2012
1.657 mln
-1.59 mln
-48.97%
jan 1, 2013
3.161 mln
+1.504 mln
90.76%
jan 1, 2014
2.623 mln
-538.699K
-17.04%
jan 1, 2015
2.749 mln
+126.123K
4.81%
Ranking of countries by current statistics by years


Comments: