29
/
en
AIzaSyAYiBZKx7MnpbEhh9jyipgxe19OcubqV5w
April 1, 2024
151372
Hong Kong SAR, China
HKG
true
2
1
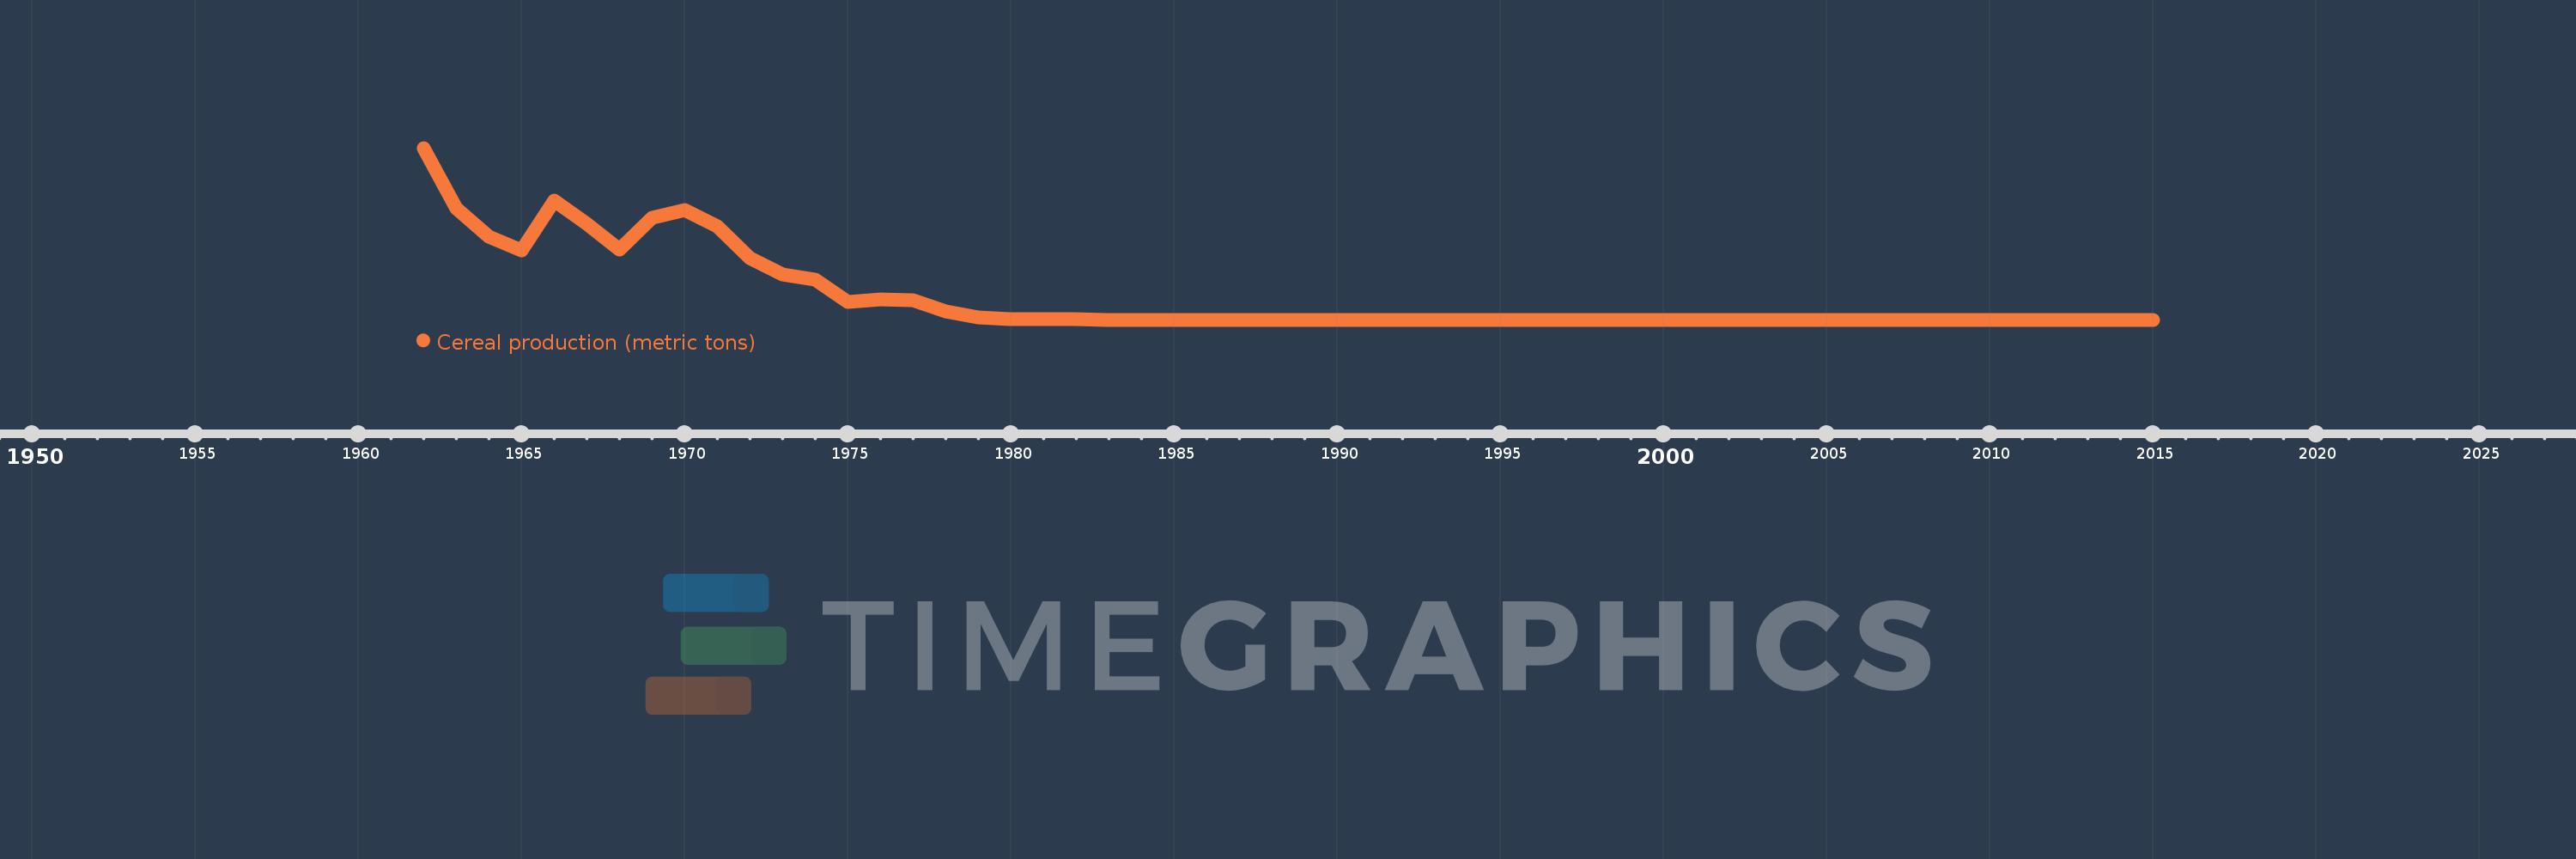
Cereal production (metric tons)
2015,2014,2013,2012,2011,2010,2009,2008,2007,2006,2005,2004,2003,2002,2001,2000,1999,1998,1997,1996,1995,1994,1993,1992,1991,1990,1989,1988,1987,1986,1985,1984,1983,1982,1981,1980,1979,1978,1977,1976,1975,1974,1973,1972,1971,1970,1969,1968,1967,1966,1965,1964,1963,1962
This statistics in other country:
AfghanistanAlbaniaAlgeriaAngolaAntigua and BarbudaArab WorldArgentinaArmeniaAustraliaAustriaAzerbaijanBahamas, TheBangladeshBarbadosBelarusBelgiumBelizeBeninBhutanBoliviaBosnia and HerzegovinaBotswanaBrazilBrunei DarussalamBulgariaBurkina FasoBurundiCabo VerdeCambodiaCameroonCanadaCaribbean small statesCentral African RepublicCentral Europe and the BalticsChadChileChinaColombiaComorosCongo, Dem. Rep.Congo, Rep.Costa RicaCote d'IvoireCroatiaCubaCyprusCzech RepublicDenmarkDjiboutiDominicaDominican RepublicEarly-demographic dividendEast Asia & PacificEast Asia & Pacific (excluding high income)East Asia & Pacific (IDA & IBRD countries)EcuadorEgypt, Arab Rep.El SalvadorEritreaEstoniaEthiopiaEuro areaEurope & Central AsiaEurope & Central Asia (excluding high income)Europe & Central Asia (IDA & IBRD countries)European UnionFijiFinlandFragile and conflict affected situationsFranceGabonGambia, TheGeorgiaGermanyGhanaGreeceGrenadaGuamGuatemalaGuineaGuinea-BissauGuyanaHaitiHeavily indebted poor countries (HIPC)High incomeHondurasHong Kong SAR, ChinaHungaryIBRD onlyIDA & IBRD totalIDA blendIDA onlyIDA totalIndiaIndonesiaIran, Islamic Rep.IraqIrelandIsraelItalyJamaicaJapanJordanKazakhstanKenyaKorea, Dem. People’s Rep.Korea, Rep.KuwaitKyrgyz RepublicLao PDRLate-demographic dividendLatin America & Caribbean Latin America & Caribbean (excluding high income)Latin America & the Caribbean (IDA & IBRD countries)LatviaLeast developed countries: UN classificationLebanonLesothoLiberiaLibyaLithuaniaLow & middle incomeLow incomeLower middle incomeLuxembourgMacedonia, FYRMadagascarMalawiMalaysiaMaldivesMaliMaltaMauritaniaMauritiusMexicoMicronesia, Fed. Sts.Middle East & North AfricaMiddle East & North Africa (excluding high income)Middle East & North Africa (IDA & IBRD countries)Middle incomeMoldovaMongoliaMontenegroMoroccoMozambiqueMyanmarNamibiaNepalNetherlandsNew CaledoniaNew ZealandNicaraguaNigerNigeriaNorth AmericaNorwayOECD membersOmanOther small statesPacific island small statesPakistanPanamaPapua New GuineaParaguayPeruPhilippinesPolandPortugalPost-demographic dividendPre-demographic dividendPuerto RicoQatarRomaniaRussian FederationRwandaSao Tome and PrincipeSaudi ArabiaSenegalSerbiaSierra LeoneSlovak RepublicSloveniaSmall statesSolomon IslandsSomaliaSouth AfricaSouth AsiaSouth Asia (IDA & IBRD)South SudanSpainSri LankaSt. LuciaSt. Vincent and the GrenadinesSub-Saharan Africa Sub-Saharan Africa (excluding high income)Sub-Saharan Africa (IDA & IBRD countries)SudanSurinameSwazilandSwedenSwitzerlandSyrian Arab RepublicTajikistanTanzaniaThailandTimor-LesteTogoTrinidad and TobagoTunisiaTurkeyTurkmenistanUgandaUkraineUnited Arab EmiratesUnited KingdomUnited StatesUpper middle incomeUruguayUzbekistanVanuatuVenezuela, RBVietnamWest Bank and GazaWorldYemen, Rep.ZambiaZimbabwe Timeline:
This timeline shows a graph from 1962 to 2015 of Hong Kong SAR, China. No data until 1961. Number of actual observations by date: 54.
Source name:
World Development Indicators
Source organization:
Food and Agriculture Organization, electronic files and web site.
Categories, topics:
Agriculture & Rural Development
Last updated:
apr 23, 2017
Indicators value changes by year
Maximum:
29.891K
jan 1, 1962
At the date of observation
Value
Absolute change
Change from previous value
jan 1, 1962
29.891K
+29.891K
0.0%
jan 1, 1963
19.428K
-10.463K
-35.0%
jan 1, 1964
14.5K
-4.928K
-25.37%
jan 1, 1965
12.06K
-2.44K
-16.83%
jan 1, 1966
20.8K
+8.74K
72.47%
jan 1, 1967
16.63K
-4.17K
-20.05%
jan 1, 1968
12.196K
-4.434K
-26.66%
jan 1, 1969
17.707K
+5.511K
45.19%
jan 1, 1970
19.082K
+1.375K
7.77%
jan 1, 1971
16.239K
-2.843K
-14.9%
jan 1, 1972
10.65K
-5.589K
-34.42%
jan 1, 1973
7.822K
-2.828K
-26.55%
jan 1, 1974
7.0K
-822.0
-10.51%
jan 1, 1975
3.08K
-3.92K
-56.0%
jan 1, 1976
3.54K
+460.0
14.94%
jan 1, 1977
3.45K
-90.0
-2.54%
jan 1, 1978
1.38K
-2.07K
-60.0%
jan 1, 1979
350.0
-1.03K
-74.64%
jan 1, 1980
100.0
-250.0
-71.43%
jan 1, 1981
70.0
-30.0
-30.0%
jan 1, 1982
30.0
-40.0
-57.14%
jan 1, 1983
20.0
-10.0
-33.33%
jan 1, 1984
12.0
-8.0
-40.0%
jan 1, 1985
24.0
+12.0
100.0%
jan 1, 1986
15.0
-9.0
-37.5%
jan 1, 1987
11.0
-4.0
-26.67%
jan 1, 1988
5.0
-6.0
-54.55%
jan 1, 1989
3.0
-2.0
-40.0%
jan 1, 1991
2.0
-1.0
-33.33%
jan 1, 1992
0.0
-2.0
-100.0%
Ranking of countries by current statistics by years


Comments: