29
/
en
AIzaSyAYiBZKx7MnpbEhh9jyipgxe19OcubqV5w
April 1, 2024
267704
Tunisia
TUN
true
2
1
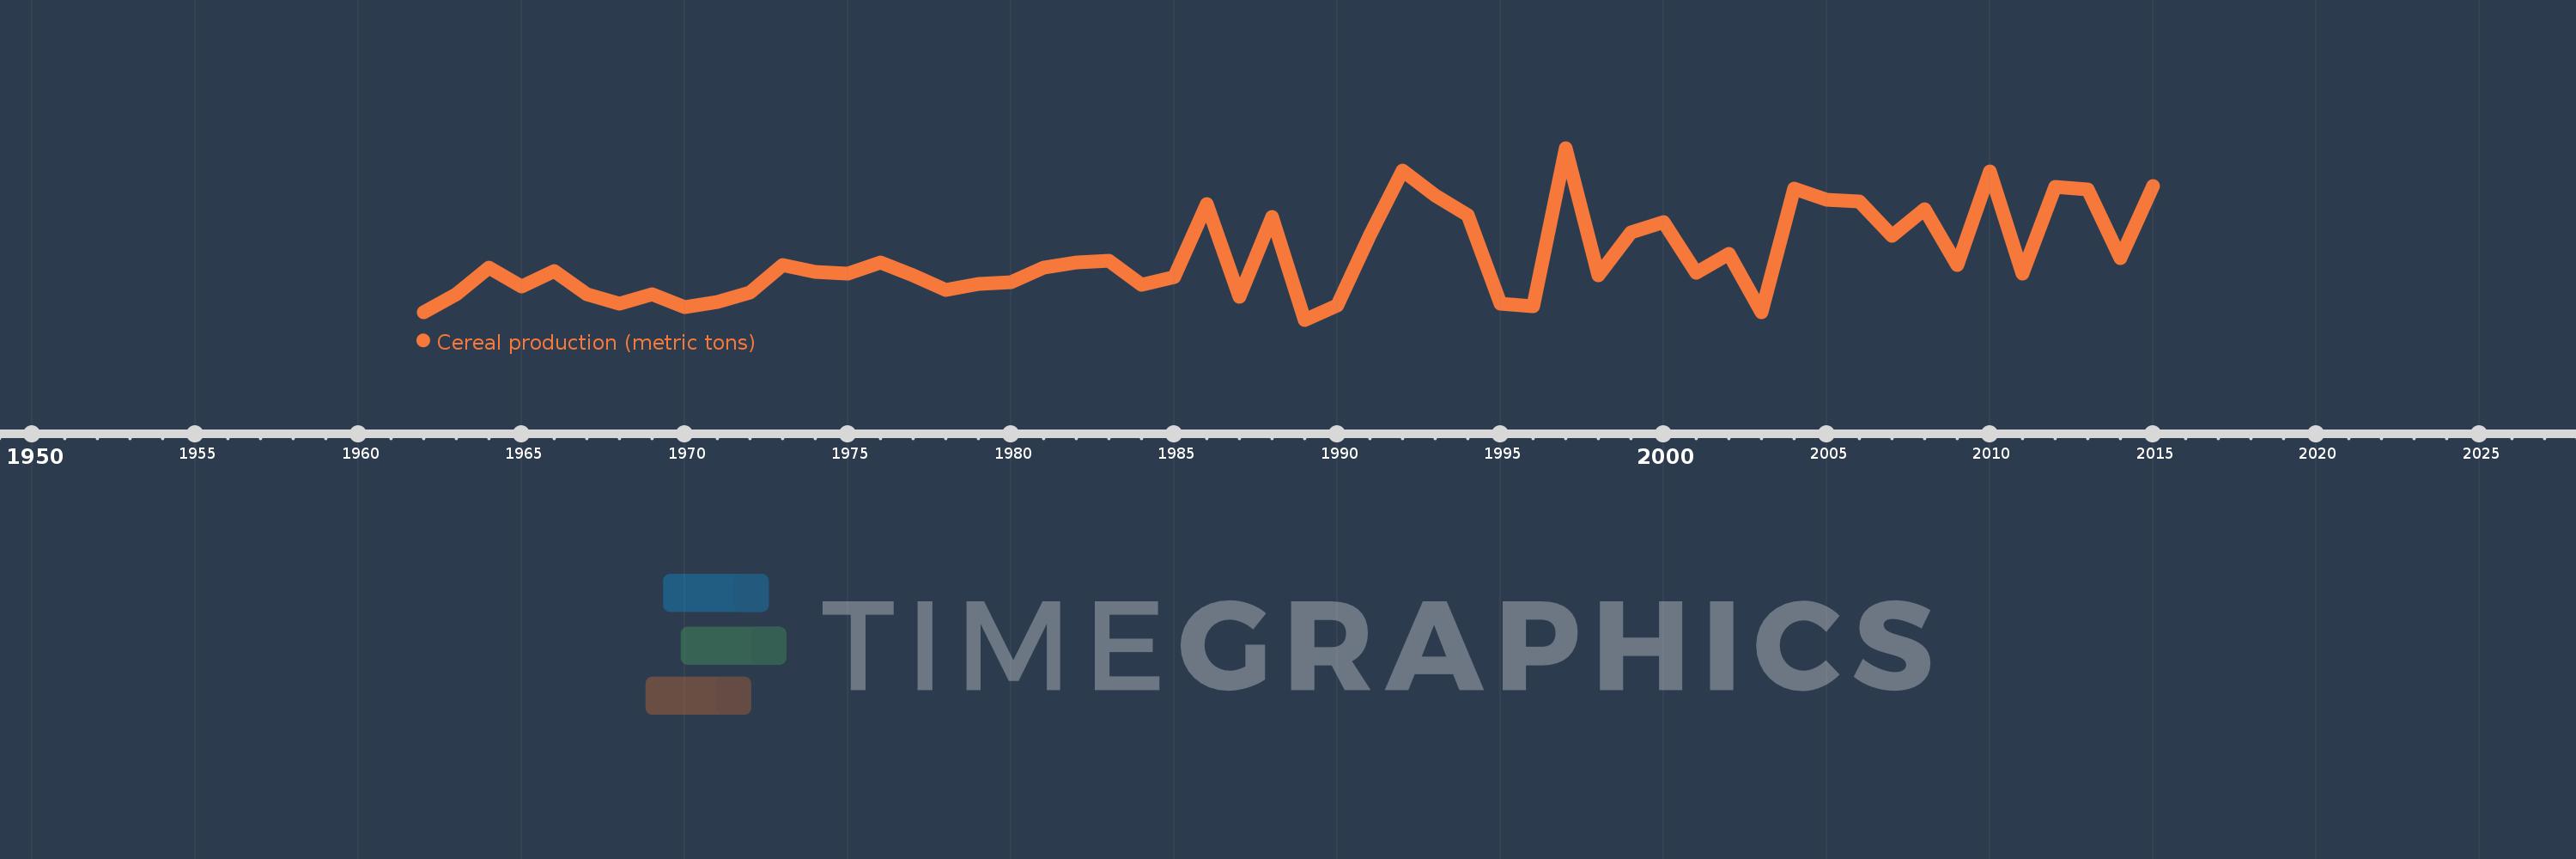
Cereal production (metric tons)
2015,2014,2013,2012,2011,2010,2009,2008,2007,2006,2005,2004,2003,2002,2001,2000,1999,1998,1997,1996,1995,1994,1993,1992,1991,1990,1989,1988,1987,1986,1985,1984,1983,1982,1981,1980,1979,1978,1977,1976,1975,1974,1973,1972,1971,1970,1969,1968,1967,1966,1965,1964,1963,1962
This statistics in other country:
AfghanistanAlbaniaAlgeriaAngolaAntigua and BarbudaArab WorldArgentinaArmeniaAustraliaAustriaAzerbaijanBahamas, TheBangladeshBarbadosBelarusBelgiumBelizeBeninBhutanBoliviaBosnia and HerzegovinaBotswanaBrazilBrunei DarussalamBulgariaBurkina FasoBurundiCabo VerdeCambodiaCameroonCanadaCaribbean small statesCentral African RepublicCentral Europe and the BalticsChadChileChinaColombiaComorosCongo, Dem. Rep.Congo, Rep.Costa RicaCote d'IvoireCroatiaCubaCyprusCzech RepublicDenmarkDjiboutiDominicaDominican RepublicEarly-demographic dividendEast Asia & PacificEast Asia & Pacific (excluding high income)East Asia & Pacific (IDA & IBRD countries)EcuadorEgypt, Arab Rep.El SalvadorEritreaEstoniaEthiopiaEuro areaEurope & Central AsiaEurope & Central Asia (excluding high income)Europe & Central Asia (IDA & IBRD countries)European UnionFijiFinlandFragile and conflict affected situationsFranceGabonGambia, TheGeorgiaGermanyGhanaGreeceGrenadaGuamGuatemalaGuineaGuinea-BissauGuyanaHaitiHeavily indebted poor countries (HIPC)High incomeHondurasHong Kong SAR, ChinaHungaryIBRD onlyIDA & IBRD totalIDA blendIDA onlyIDA totalIndiaIndonesiaIran, Islamic Rep.IraqIrelandIsraelItalyJamaicaJapanJordanKazakhstanKenyaKorea, Dem. People’s Rep.Korea, Rep.KuwaitKyrgyz RepublicLao PDRLate-demographic dividendLatin America & Caribbean Latin America & Caribbean (excluding high income)Latin America & the Caribbean (IDA & IBRD countries)LatviaLeast developed countries: UN classificationLebanonLesothoLiberiaLibyaLithuaniaLow & middle incomeLow incomeLower middle incomeLuxembourgMacedonia, FYRMadagascarMalawiMalaysiaMaldivesMaliMaltaMauritaniaMauritiusMexicoMicronesia, Fed. Sts.Middle East & North AfricaMiddle East & North Africa (excluding high income)Middle East & North Africa (IDA & IBRD countries)Middle incomeMoldovaMongoliaMontenegroMoroccoMozambiqueMyanmarNamibiaNepalNetherlandsNew CaledoniaNew ZealandNicaraguaNigerNigeriaNorth AmericaNorwayOECD membersOmanOther small statesPacific island small statesPakistanPanamaPapua New GuineaParaguayPeruPhilippinesPolandPortugalPost-demographic dividendPre-demographic dividendPuerto RicoQatarRomaniaRussian FederationRwandaSao Tome and PrincipeSaudi ArabiaSenegalSerbiaSierra LeoneSlovak RepublicSloveniaSmall statesSolomon IslandsSomaliaSouth AfricaSouth AsiaSouth Asia (IDA & IBRD)South SudanSpainSri LankaSt. LuciaSt. Vincent and the GrenadinesSub-Saharan Africa Sub-Saharan Africa (excluding high income)Sub-Saharan Africa (IDA & IBRD countries)SudanSurinameSwazilandSwedenSwitzerlandSyrian Arab RepublicTajikistanTanzaniaThailandTimor-LesteTogoTrinidad and TobagoTunisiaTurkeyTurkmenistanUgandaUkraineUnited Arab EmiratesUnited KingdomUnited StatesUpper middle incomeUruguayUzbekistanVanuatuVenezuela, RBVietnamWest Bank and GazaWorldYemen, Rep.ZambiaZimbabwe Timeline:
This timeline shows a graph from 1962 to 2015 of Tunisia. No data until 1961. Number of actual observations by date: 54.
Source name:
World Development Indicators
Source organization:
Food and Agriculture Organization, electronic files and web site.
Categories, topics:
Agriculture & Rural Development
Last updated:
apr 23, 2017
Indicators value changes by year
Minimum:
450.0K
jan 1, 1989
Maximum:
2.896 mln
jan 1, 1997
At the date of observation
Value
Absolute change
Change from previous value
jan 1, 1962
561.618K
+561.618K
0.0%
jan 1, 1963
814.367K
+252.749K
45.0%
jan 1, 1964
1.193 mln
+378.933K
46.53%
jan 1, 1965
922.0K
-271.3K
-22.74%
jan 1, 1966
1.141 mln
+219.5K
23.81%
jan 1, 1967
813.0K
-328.5K
-28.78%
jan 1, 1968
683.0K
-130.0K
-15.99%
jan 1, 1969
812.6K
+129.6K
18.98%
jan 1, 1970
632.4K
-180.2K
-22.18%
jan 1, 1971
704.4K
+72.0K
11.39%
jan 1, 1972
835.8K
+131.4K
18.65%
jan 1, 1973
1.231 mln
+395.5K
47.32%
jan 1, 1974
1.128 mln
-103.1K
-8.37%
jan 1, 1975
1.109 mln
-19.6K
-1.74%
jan 1, 1976
1.271 mln
+162.5K
14.66%
jan 1, 1977
1.078 mln
-192.8K
-15.17%
jan 1, 1978
880.3K
-198.0K
-18.36%
jan 1, 1979
959.0K
+78.7K
8.94%
jan 1, 1980
979.5K
+20.5K
2.14%
jan 1, 1981
1.197 mln
+217.3K
22.18%
jan 1, 1982
1.262 mln
+65.2K
5.45%
jan 1, 1983
1.285 mln
+23.0K
1.82%
jan 1, 1984
951.0K
-334.0K
-25.99%
jan 1, 1985
1.053 mln
+102.42K
10.77%
jan 1, 1986
2.098 mln
+1.045 mln
99.16%
jan 1, 1987
782.0K
-1.316 mln
-62.73%
jan 1, 1988
1.919 mln
+1.137 mln
145.46%
jan 1, 1989
450.0K
-1.47 mln
-76.56%
jan 1, 1990
655.6K
+205.6K
45.69%
jan 1, 1991
1.655 mln
+999.247K
152.42%
jan 1, 1992
2.574 mln
+919.209K
55.55%
jan 1, 1993
2.219 mln
-354.652K
-13.78%
jan 1, 1994
1.939 mln
-280.136K
-12.62%
jan 1, 1995
682.5K
-1.257 mln
-64.81%
jan 1, 1996
647.776K
-34.724K
-5.09%
jan 1, 1997
2.896 mln
+2.249 mln
347.12%
jan 1, 1998
1.085 mln
-1.811 mln
-62.53%
jan 1, 1999
1.698 mln
+612.685K
56.46%
jan 1, 2000
1.839 mln
+141.335K
8.32%
jan 1, 2001
1.122 mln
-717.46K
-39.01%
jan 1, 2002
1.391 mln
+269.805K
24.05%
jan 1, 2003
551.31K
-840.19K
-60.38%
jan 1, 2004
2.32 mln
+1.769 mln
320.78%
jan 1, 2005
2.164 mln
-155.315K
-6.7%
jan 1, 2006
2.136 mln
-28.197K
-1.3%
jan 1, 2007
1.648 mln
-488.093K
-22.85%
jan 1, 2008
2.025 mln
+377.063K
22.88%
jan 1, 2009
1.224 mln
-800.992K
-39.55%
jan 1, 2010
2.562 mln
+1.338 mln
109.27%
jan 1, 2011
1.113 mln
-1.449 mln
-56.56%
jan 1, 2012
2.343 mln
+1.23 mln
110.57%
jan 1, 2013
2.306 mln
-37.412K
-1.6%
jan 1, 2014
1.328 mln
-977.68K
-42.4%
jan 1, 2015
2.35 mln
+1.022 mln
76.95%
Ranking of countries by current statistics by years


Comments: