29
/
en
AIzaSyAYiBZKx7MnpbEhh9jyipgxe19OcubqV5w
April 1, 2024
44872
Low & middle income
LMY
false
2
1
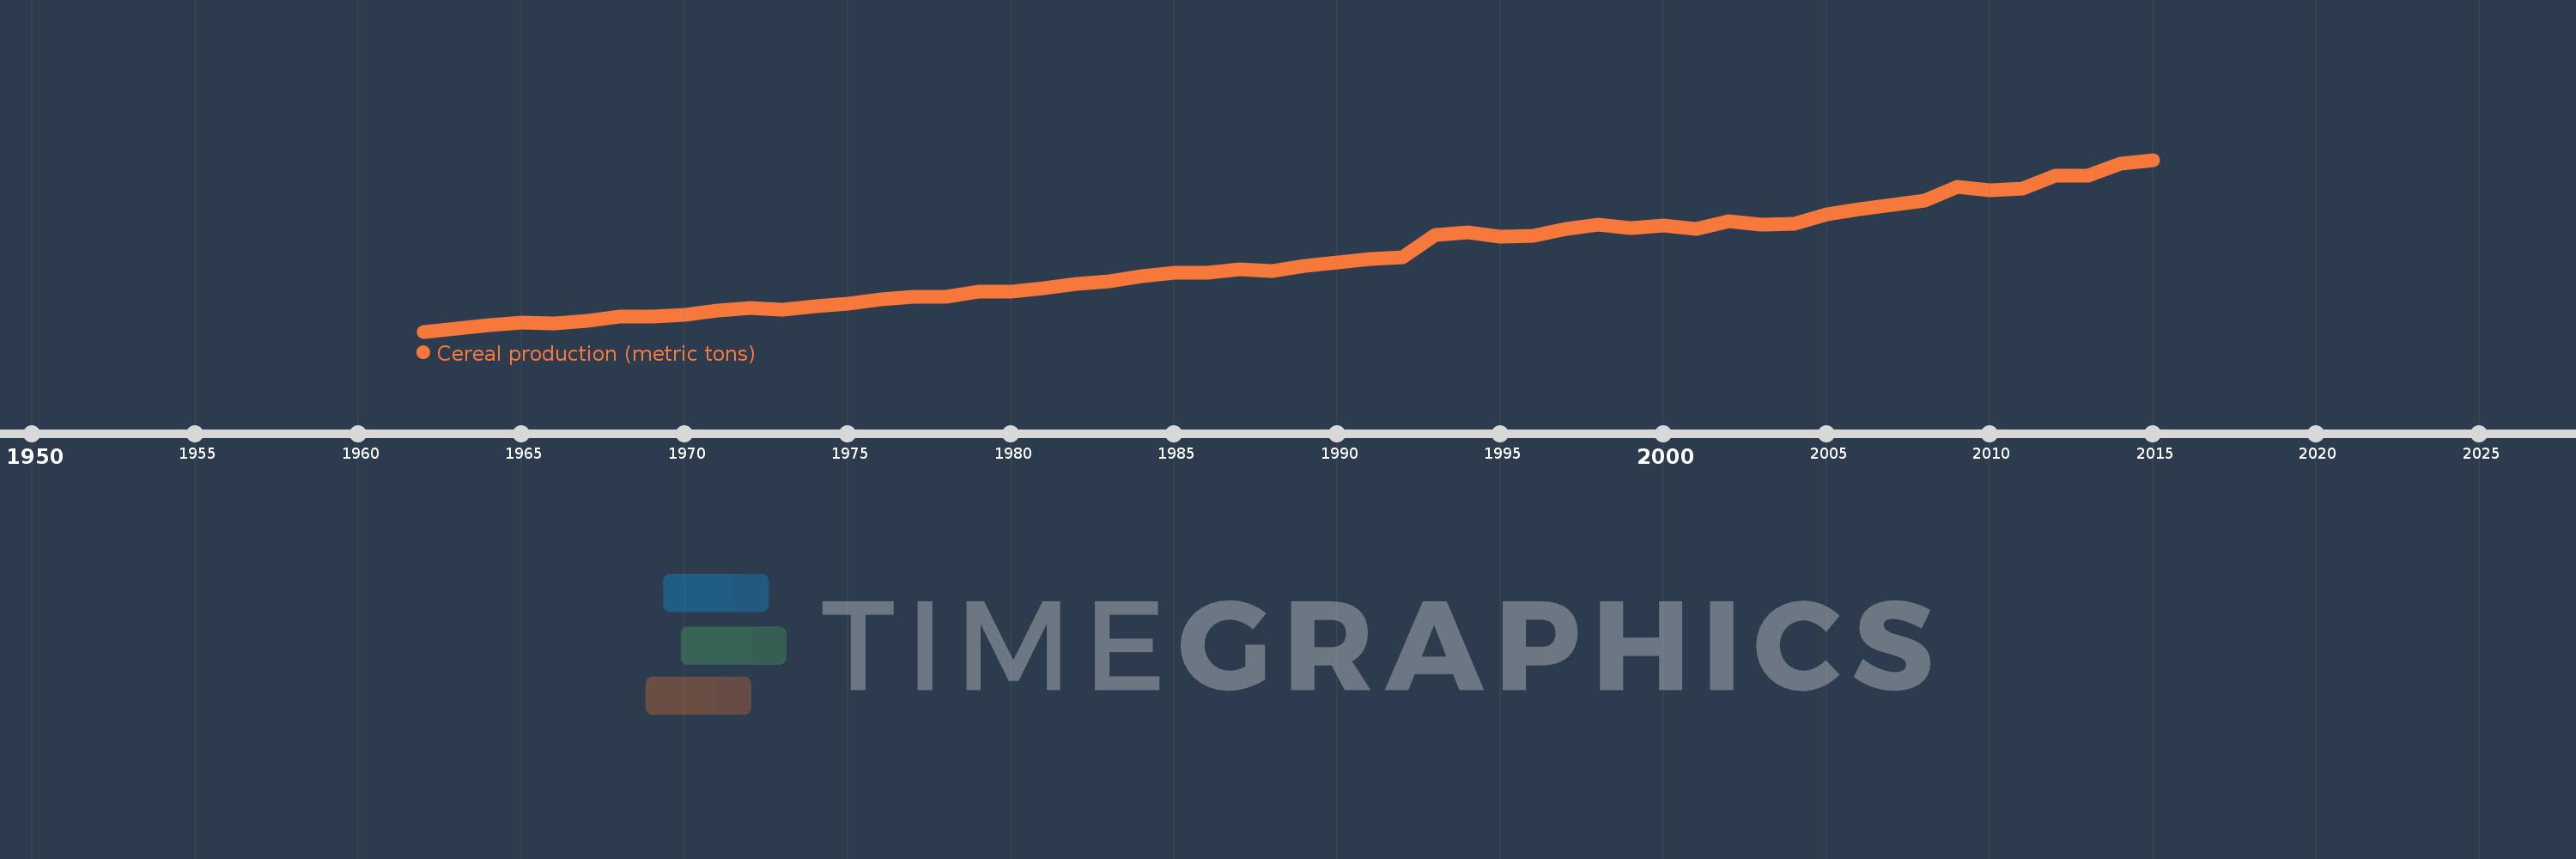
Cereal production (metric tons)
2015,2014,2013,2012,2011,2010,2009,2008,2007,2006,2005,2004,2003,2002,2001,2000,1999,1998,1997,1996,1995,1994,1993,1992,1991,1990,1989,1988,1987,1986,1985,1984,1983,1982,1981,1980,1979,1978,1977,1976,1975,1974,1973,1972,1971,1970,1969,1968,1967,1966,1965,1964,1963,1962
This statistics in other country:
AfghanistanAlbaniaAlgeriaAngolaAntigua and BarbudaArab WorldArgentinaArmeniaAustraliaAustriaAzerbaijanBahamas, TheBangladeshBarbadosBelarusBelgiumBelizeBeninBhutanBoliviaBosnia and HerzegovinaBotswanaBrazilBrunei DarussalamBulgariaBurkina FasoBurundiCabo VerdeCambodiaCameroonCanadaCaribbean small statesCentral African RepublicCentral Europe and the BalticsChadChileChinaColombiaComorosCongo, Dem. Rep.Congo, Rep.Costa RicaCote d'IvoireCroatiaCubaCyprusCzech RepublicDenmarkDjiboutiDominicaDominican RepublicEarly-demographic dividendEast Asia & PacificEast Asia & Pacific (excluding high income)East Asia & Pacific (IDA & IBRD countries)EcuadorEgypt, Arab Rep.El SalvadorEritreaEstoniaEthiopiaEuro areaEurope & Central AsiaEurope & Central Asia (excluding high income)Europe & Central Asia (IDA & IBRD countries)European UnionFijiFinlandFragile and conflict affected situationsFranceGabonGambia, TheGeorgiaGermanyGhanaGreeceGrenadaGuamGuatemalaGuineaGuinea-BissauGuyanaHaitiHeavily indebted poor countries (HIPC)High incomeHondurasHong Kong SAR, ChinaHungaryIBRD onlyIDA & IBRD totalIDA blendIDA onlyIDA totalIndiaIndonesiaIran, Islamic Rep.IraqIrelandIsraelItalyJamaicaJapanJordanKazakhstanKenyaKorea, Dem. People’s Rep.Korea, Rep.KuwaitKyrgyz RepublicLao PDRLate-demographic dividendLatin America & Caribbean Latin America & Caribbean (excluding high income)Latin America & the Caribbean (IDA & IBRD countries)LatviaLeast developed countries: UN classificationLebanonLesothoLiberiaLibyaLithuaniaLow & middle incomeLow incomeLower middle incomeLuxembourgMacedonia, FYRMadagascarMalawiMalaysiaMaldivesMaliMaltaMauritaniaMauritiusMexicoMicronesia, Fed. Sts.Middle East & North AfricaMiddle East & North Africa (excluding high income)Middle East & North Africa (IDA & IBRD countries)Middle incomeMoldovaMongoliaMontenegroMoroccoMozambiqueMyanmarNamibiaNepalNetherlandsNew CaledoniaNew ZealandNicaraguaNigerNigeriaNorth AmericaNorwayOECD membersOmanOther small statesPacific island small statesPakistanPanamaPapua New GuineaParaguayPeruPhilippinesPolandPortugalPost-demographic dividendPre-demographic dividendPuerto RicoQatarRomaniaRussian FederationRwandaSao Tome and PrincipeSaudi ArabiaSenegalSerbiaSierra LeoneSlovak RepublicSloveniaSmall statesSolomon IslandsSomaliaSouth AfricaSouth AsiaSouth Asia (IDA & IBRD)South SudanSpainSri LankaSt. LuciaSt. Vincent and the GrenadinesSub-Saharan Africa Sub-Saharan Africa (excluding high income)Sub-Saharan Africa (IDA & IBRD countries)SudanSurinameSwazilandSwedenSwitzerlandSyrian Arab RepublicTajikistanTanzaniaThailandTimor-LesteTogoTrinidad and TobagoTunisiaTurkeyTurkmenistanUgandaUkraineUnited Arab EmiratesUnited KingdomUnited StatesUpper middle incomeUruguayUzbekistanVanuatuVenezuela, RBVietnamWest Bank and GazaWorldYemen, Rep.ZambiaZimbabwe Timeline:
This timeline shows a graph from 1962 to 2015 of Low & middle income. No data until 1961. Number of actual observations by date: 54.
Source name:
World Development Indicators
Source organization:
Food and Agriculture Organization, electronic files and web site.
Categories, topics:
Agriculture & Rural Development
Last updated:
apr 23, 2017
Indicators value changes by year
Minimum:
406.069 mln
jan 1, 1962
Maximum:
1.952 bln
jan 1, 2015
At the date of observation
Value
Absolute change
Change from previous value
jan 1, 1962
406.069 mln
+406.069 mln
0.0%
jan 1, 1963
431.118 mln
+25.049 mln
6.17%
jan 1, 1964
461.985 mln
+30.867 mln
7.16%
jan 1, 1965
485.757 mln
+23.772 mln
5.15%
jan 1, 1966
481.211 mln
-4.546 mln
-0.94%
jan 1, 1967
499.668 mln
+18.458 mln
3.84%
jan 1, 1968
538.757 mln
+39.088 mln
7.82%
jan 1, 1969
543.43 mln
+4.673 mln
0.87%
jan 1, 1970
558.725 mln
+15.295 mln
2.81%
jan 1, 1971
598.453 mln
+39.729 mln
7.11%
jan 1, 1972
620.969 mln
+22.515 mln
3.76%
jan 1, 1973
606.322 mln
-14.647 mln
-2.36%
jan 1, 1974
636.055 mln
+29.733 mln
4.9%
jan 1, 1975
654.054 mln
+17.999 mln
2.83%
jan 1, 1976
699.464 mln
+45.409 mln
6.94%
jan 1, 1977
718.707 mln
+19.243 mln
2.75%
jan 1, 1978
719.448 mln
+740.832K
0.1%
jan 1, 1979
766.662 mln
+47.214 mln
6.56%
jan 1, 1980
767.001 mln
+338.523K
0.04%
jan 1, 1981
794.653 mln
+27.652 mln
3.61%
jan 1, 1982
835.411 mln
+40.758 mln
5.13%
jan 1, 1983
854.784 mln
+19.373 mln
2.32%
jan 1, 1984
906.26 mln
+51.476 mln
6.02%
jan 1, 1985
938.403 mln
+32.143 mln
3.55%
jan 1, 1986
938.931 mln
+527.894K
0.06%
jan 1, 1987
962.769 mln
+23.838 mln
2.54%
jan 1, 1988
950.163 mln
-12.605 mln
-1.31%
jan 1, 1989
998.84 mln
+48.677 mln
5.12%
jan 1, 1990
1.029 bln
+30.283 mln
3.03%
jan 1, 1991
1.056 bln
+27.301 mln
2.65%
jan 1, 1992
1.074 bln
+17.487 mln
1.66%
jan 1, 1993
1.273 bln
+199.442 mln
18.57%
jan 1, 1994
1.297 bln
+23.489 mln
1.84%
jan 1, 1995
1.264 bln
-33.28 mln
-2.57%
jan 1, 1996
1.268 bln
+4.195 mln
0.33%
jan 1, 1997
1.331 bln
+62.953 mln
4.97%
jan 1, 1998
1.367 bln
+36.453 mln
2.74%
jan 1, 1999
1.34 bln
-27.577 mln
-2.02%
jan 1, 2000
1.359 bln
+19.884 mln
1.48%
jan 1, 2001
1.328 bln
-31.811 mln
-2.34%
jan 1, 2002
1.398 bln
+70.157 mln
5.28%
jan 1, 2003
1.369 bln
-28.619 mln
-2.05%
jan 1, 2004
1.376 bln
+6.769 mln
0.49%
jan 1, 2005
1.463 bln
+87.096 mln
6.33%
jan 1, 2006
1.505 bln
+42.151 mln
2.88%
jan 1, 2007
1.543 bln
+38.138 mln
2.53%
jan 1, 2008
1.581 bln
+37.822 mln
2.45%
jan 1, 2009
1.71 bln
+129.083 mln
8.16%
jan 1, 2010
1.68 bln
-30.422 mln
-1.78%
jan 1, 2011
1.697 bln
+16.84 mln
1.0%
jan 1, 2012
1.811 bln
+114.662 mln
6.76%
jan 1, 2013
1.81 bln
-1.684 mln
-0.09%
jan 1, 2014
1.915 bln
+105.197 mln
5.81%
jan 1, 2015
1.952 bln
+36.866 mln
1.93%
Ranking of countries by current statistics by years


Comments: