29
/
en
AIzaSyAYiBZKx7MnpbEhh9jyipgxe19OcubqV5w
April 1, 2024
27913
East Asia & Pacific (excluding high income)
EAP
false
2
1
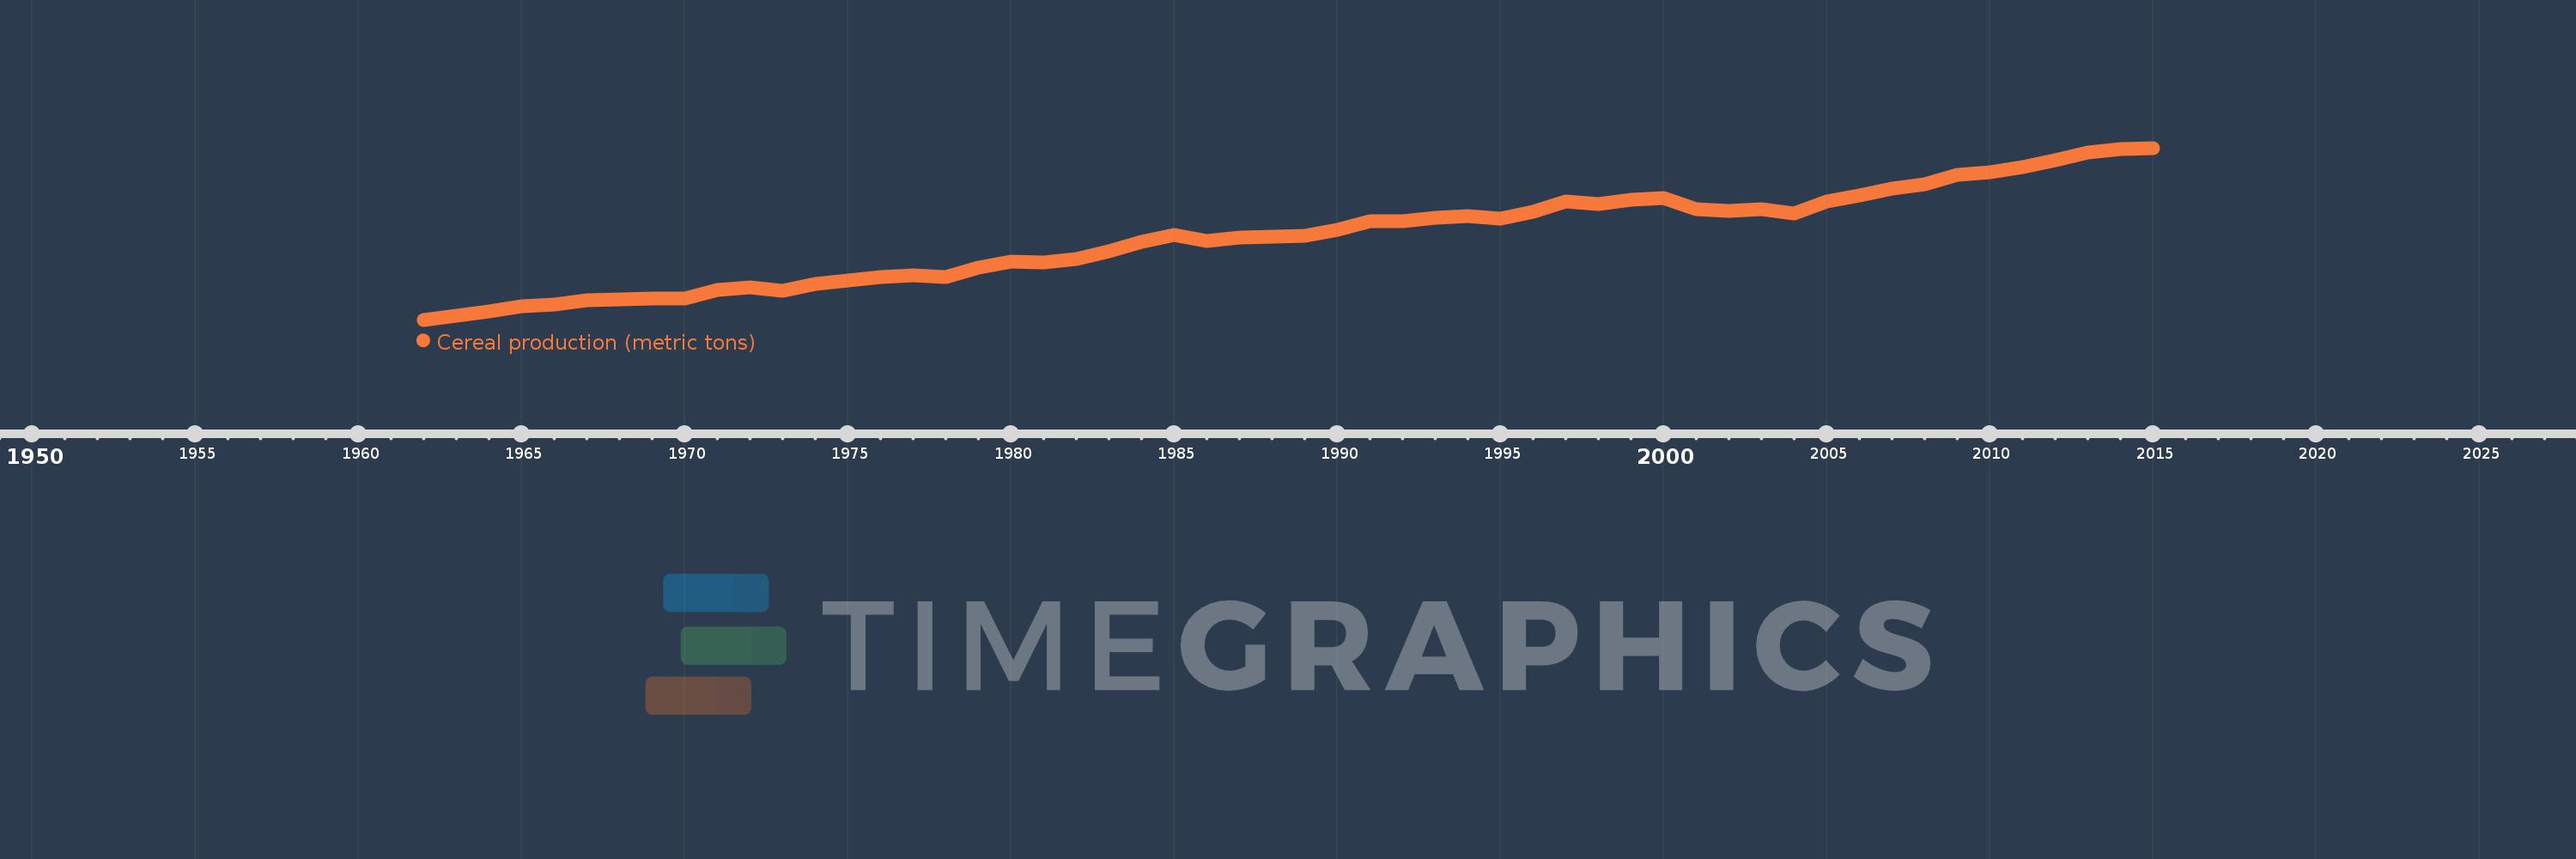
Cereal production (metric tons)
2015,2014,2013,2012,2011,2010,2009,2008,2007,2006,2005,2004,2003,2002,2001,2000,1999,1998,1997,1996,1995,1994,1993,1992,1991,1990,1989,1988,1987,1986,1985,1984,1983,1982,1981,1980,1979,1978,1977,1976,1975,1974,1973,1972,1971,1970,1969,1968,1967,1966,1965,1964,1963,1962
This statistics in other country:
AfghanistanAlbaniaAlgeriaAngolaAntigua and BarbudaArab WorldArgentinaArmeniaAustraliaAustriaAzerbaijanBahamas, TheBangladeshBarbadosBelarusBelgiumBelizeBeninBhutanBoliviaBosnia and HerzegovinaBotswanaBrazilBrunei DarussalamBulgariaBurkina FasoBurundiCabo VerdeCambodiaCameroonCanadaCaribbean small statesCentral African RepublicCentral Europe and the BalticsChadChileChinaColombiaComorosCongo, Dem. Rep.Congo, Rep.Costa RicaCote d'IvoireCroatiaCubaCyprusCzech RepublicDenmarkDjiboutiDominicaDominican RepublicEarly-demographic dividendEast Asia & PacificEast Asia & Pacific (excluding high income)East Asia & Pacific (IDA & IBRD countries)EcuadorEgypt, Arab Rep.El SalvadorEritreaEstoniaEthiopiaEuro areaEurope & Central AsiaEurope & Central Asia (excluding high income)Europe & Central Asia (IDA & IBRD countries)European UnionFijiFinlandFragile and conflict affected situationsFranceGabonGambia, TheGeorgiaGermanyGhanaGreeceGrenadaGuamGuatemalaGuineaGuinea-BissauGuyanaHaitiHeavily indebted poor countries (HIPC)High incomeHondurasHong Kong SAR, ChinaHungaryIBRD onlyIDA & IBRD totalIDA blendIDA onlyIDA totalIndiaIndonesiaIran, Islamic Rep.IraqIrelandIsraelItalyJamaicaJapanJordanKazakhstanKenyaKorea, Dem. People’s Rep.Korea, Rep.KuwaitKyrgyz RepublicLao PDRLate-demographic dividendLatin America & Caribbean Latin America & Caribbean (excluding high income)Latin America & the Caribbean (IDA & IBRD countries)LatviaLeast developed countries: UN classificationLebanonLesothoLiberiaLibyaLithuaniaLow & middle incomeLow incomeLower middle incomeLuxembourgMacedonia, FYRMadagascarMalawiMalaysiaMaldivesMaliMaltaMauritaniaMauritiusMexicoMicronesia, Fed. Sts.Middle East & North AfricaMiddle East & North Africa (excluding high income)Middle East & North Africa (IDA & IBRD countries)Middle incomeMoldovaMongoliaMontenegroMoroccoMozambiqueMyanmarNamibiaNepalNetherlandsNew CaledoniaNew ZealandNicaraguaNigerNigeriaNorth AmericaNorwayOECD membersOmanOther small statesPacific island small statesPakistanPanamaPapua New GuineaParaguayPeruPhilippinesPolandPortugalPost-demographic dividendPre-demographic dividendPuerto RicoQatarRomaniaRussian FederationRwandaSao Tome and PrincipeSaudi ArabiaSenegalSerbiaSierra LeoneSlovak RepublicSloveniaSmall statesSolomon IslandsSomaliaSouth AfricaSouth AsiaSouth Asia (IDA & IBRD)South SudanSpainSri LankaSt. LuciaSt. Vincent and the GrenadinesSub-Saharan Africa Sub-Saharan Africa (excluding high income)Sub-Saharan Africa (IDA & IBRD countries)SudanSurinameSwazilandSwedenSwitzerlandSyrian Arab RepublicTajikistanTanzaniaThailandTimor-LesteTogoTrinidad and TobagoTunisiaTurkeyTurkmenistanUgandaUkraineUnited Arab EmiratesUnited KingdomUnited StatesUpper middle incomeUruguayUzbekistanVanuatuVenezuela, RBVietnamWest Bank and GazaWorldYemen, Rep.ZambiaZimbabwe Timeline:
This timeline shows a graph from 1962 to 2015 of East Asia & Pacific (excluding high income). No data until 1961. Number of actual observations by date: 54.
Source name:
World Development Indicators
Source organization:
Food and Agriculture Organization, electronic files and web site.
Categories, topics:
Agriculture & Rural Development
Last updated:
apr 23, 2017
Indicators value changes by year
Minimum:
161.517 mln
jan 1, 1962
Maximum:
814.738 mln
jan 1, 2015
At the date of observation
Value
Absolute change
Change from previous value
jan 1, 1962
161.517 mln
+161.517 mln
0.0%
jan 1, 1963
176.892 mln
+15.375 mln
9.52%
jan 1, 1964
193.665 mln
+16.773 mln
9.48%
jan 1, 1965
211.518 mln
+17.853 mln
9.22%
jan 1, 1966
218.797 mln
+7.279 mln
3.44%
jan 1, 1967
236.667 mln
+17.87 mln
8.17%
jan 1, 1968
238.484 mln
+1.817 mln
0.77%
jan 1, 1969
240.583 mln
+2.099 mln
0.88%
jan 1, 1970
243.374 mln
+2.791 mln
1.16%
jan 1, 1971
273.263 mln
+29.89 mln
12.28%
jan 1, 1972
284.937 mln
+11.674 mln
4.27%
jan 1, 1973
273.043 mln
-11.895 mln
-4.17%
jan 1, 1974
298.39 mln
+25.347 mln
9.28%
jan 1, 1975
310.431 mln
+12.041 mln
4.04%
jan 1, 1976
323.535 mln
+13.104 mln
4.22%
jan 1, 1977
331.298 mln
+7.763 mln
2.4%
jan 1, 1978
322.848 mln
-8.45 mln
-2.55%
jan 1, 1979
361.006 mln
+38.157 mln
11.82%
jan 1, 1980
381.565 mln
+20.559 mln
5.69%
jan 1, 1981
379.086 mln
-2.479 mln
-0.65%
jan 1, 1982
392.258 mln
+13.172 mln
3.47%
jan 1, 1983
421.391 mln
+29.133 mln
7.43%
jan 1, 1984
458.361 mln
+36.97 mln
8.77%
jan 1, 1985
483.833 mln
+25.472 mln
5.56%
jan 1, 1986
461.904 mln
-21.93 mln
-4.53%
jan 1, 1987
475.595 mln
+13.691 mln
2.96%
jan 1, 1988
477.524 mln
+1.929 mln
0.41%
jan 1, 1989
480.879 mln
+3.355 mln
0.7%
jan 1, 1990
502.446 mln
+21.567 mln
4.49%
jan 1, 1991
537.556 mln
+35.11 mln
6.99%
jan 1, 1992
534.671 mln
-2.885 mln
-0.54%
jan 1, 1993
548.848 mln
+14.176 mln
2.65%
jan 1, 1994
554.512 mln
+5.664 mln
1.03%
jan 1, 1995
545.017 mln
-9.495 mln
-1.71%
jan 1, 1996
571.2 mln
+26.183 mln
4.8%
jan 1, 1997
610.423 mln
+39.223 mln
6.87%
jan 1, 1998
602.091 mln
-8.332 mln
-1.36%
jan 1, 1999
616.922 mln
+14.831 mln
2.46%
jan 1, 2000
624.815 mln
+7.893 mln
1.28%
jan 1, 2001
582.855 mln
-41.96 mln
-6.72%
jan 1, 2002
576.732 mln
-6.122 mln
-1.05%
jan 1, 2003
580.922 mln
+4.19 mln
0.73%
jan 1, 2004
565.997 mln
-14.924 mln
-2.57%
jan 1, 2005
609.942 mln
+43.945 mln
7.76%
jan 1, 2006
634.164 mln
+24.222 mln
3.97%
jan 1, 2007
661.496 mln
+27.332 mln
4.31%
jan 1, 2008
676.649 mln
+15.153 mln
2.29%
jan 1, 2009
712.026 mln
+35.377 mln
5.23%
jan 1, 2010
722.269 mln
+10.243 mln
1.44%
jan 1, 2011
743.441 mln
+21.172 mln
2.93%
jan 1, 2012
767.843 mln
+24.402 mln
3.28%
jan 1, 2013
797.016 mln
+29.173 mln
3.8%
jan 1, 2014
811.602 mln
+14.586 mln
1.83%
jan 1, 2015
814.738 mln
+3.136 mln
0.39%
Ranking of countries by current statistics by years


Comments: