29
/
en
AIzaSyAYiBZKx7MnpbEhh9jyipgxe19OcubqV5w
April 1, 2024
34075
Fragile and conflict affected situations
FCS
false
2
1
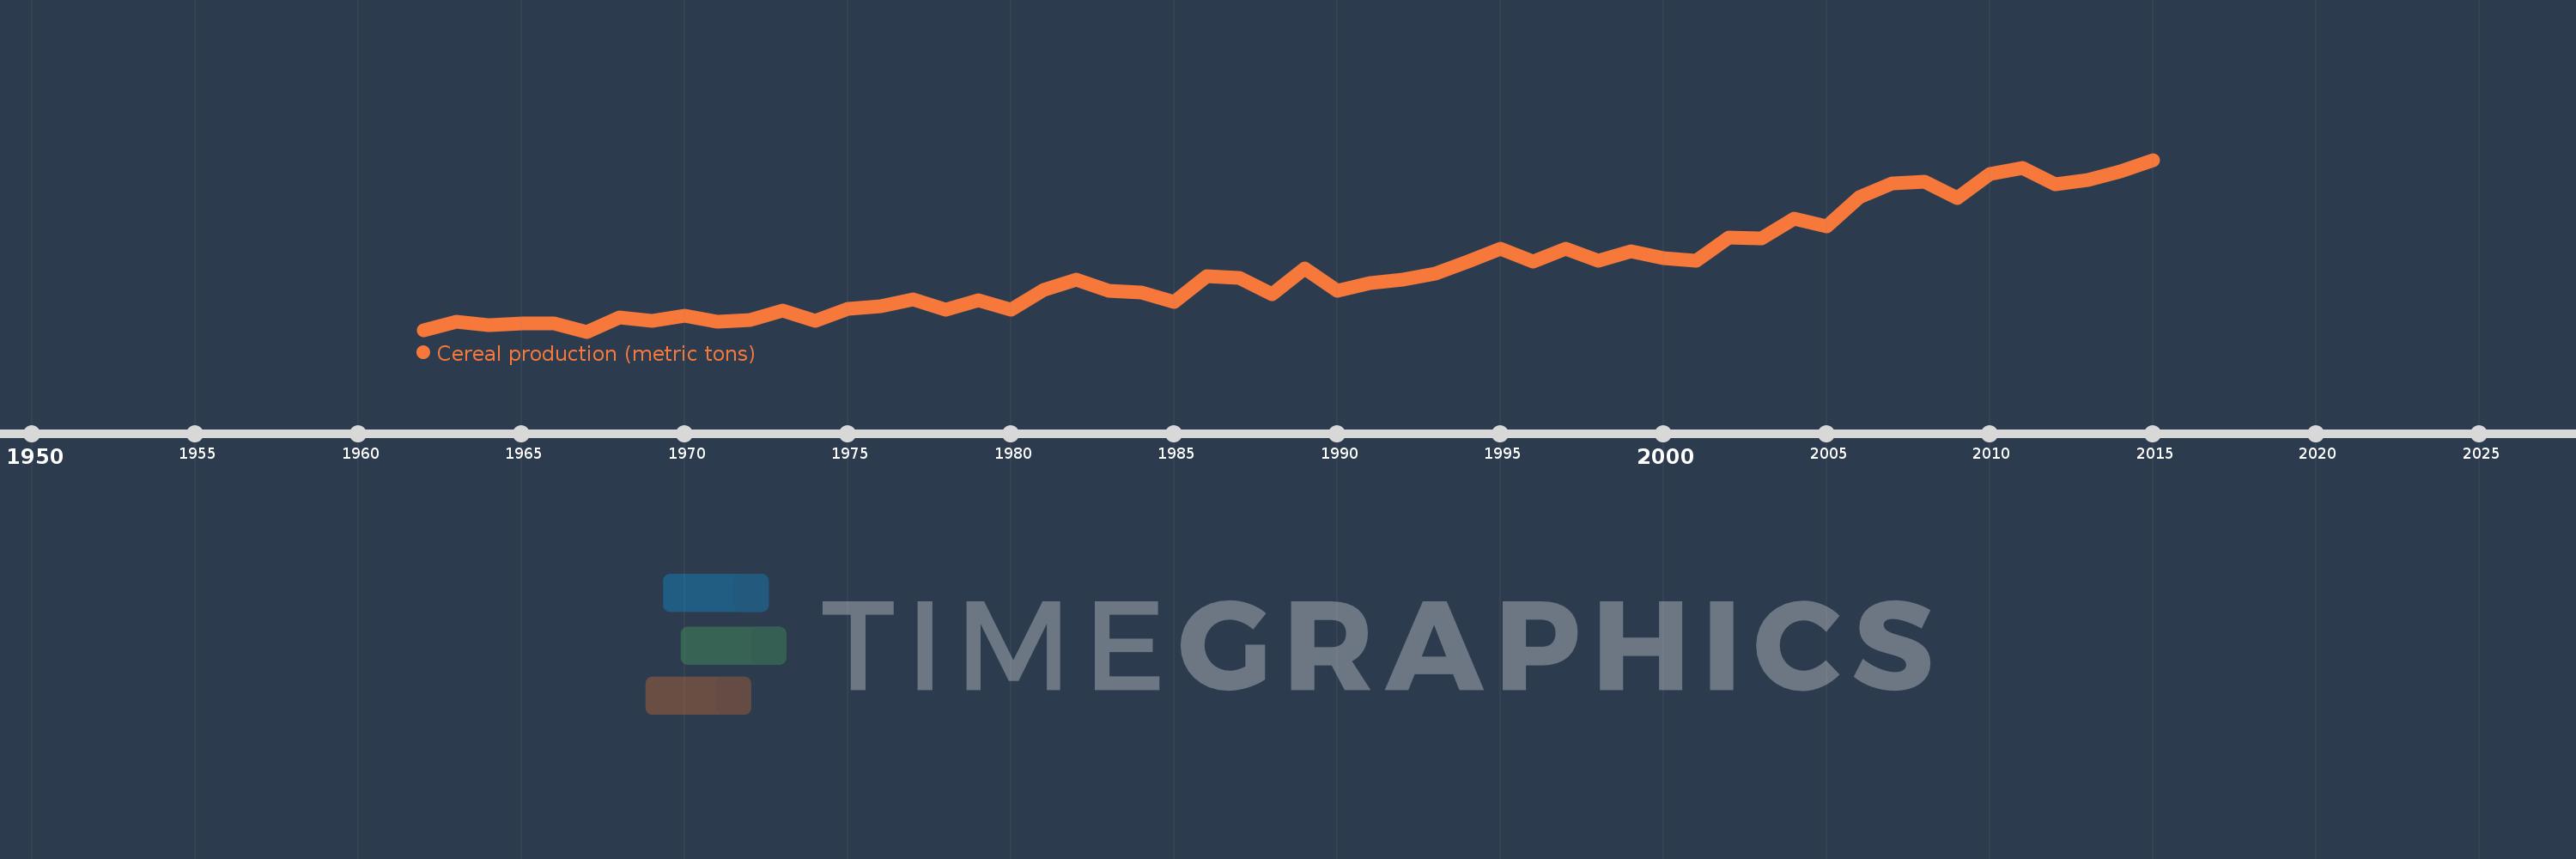
Cereal production (metric tons)
2015,2014,2013,2012,2011,2010,2009,2008,2007,2006,2005,2004,2003,2002,2001,2000,1999,1998,1997,1996,1995,1994,1993,1992,1991,1990,1989,1988,1987,1986,1985,1984,1983,1982,1981,1980,1979,1978,1977,1976,1975,1974,1973,1972,1971,1970,1969,1968,1967,1966,1965,1964,1963,1962
This statistics in other country:
AfghanistanAlbaniaAlgeriaAngolaAntigua and BarbudaArab WorldArgentinaArmeniaAustraliaAustriaAzerbaijanBahamas, TheBangladeshBarbadosBelarusBelgiumBelizeBeninBhutanBoliviaBosnia and HerzegovinaBotswanaBrazilBrunei DarussalamBulgariaBurkina FasoBurundiCabo VerdeCambodiaCameroonCanadaCaribbean small statesCentral African RepublicCentral Europe and the BalticsChadChileChinaColombiaComorosCongo, Dem. Rep.Congo, Rep.Costa RicaCote d'IvoireCroatiaCubaCyprusCzech RepublicDenmarkDjiboutiDominicaDominican RepublicEarly-demographic dividendEast Asia & PacificEast Asia & Pacific (excluding high income)East Asia & Pacific (IDA & IBRD countries)EcuadorEgypt, Arab Rep.El SalvadorEritreaEstoniaEthiopiaEuro areaEurope & Central AsiaEurope & Central Asia (excluding high income)Europe & Central Asia (IDA & IBRD countries)European UnionFijiFinlandFragile and conflict affected situationsFranceGabonGambia, TheGeorgiaGermanyGhanaGreeceGrenadaGuamGuatemalaGuineaGuinea-BissauGuyanaHaitiHeavily indebted poor countries (HIPC)High incomeHondurasHong Kong SAR, ChinaHungaryIBRD onlyIDA & IBRD totalIDA blendIDA onlyIDA totalIndiaIndonesiaIran, Islamic Rep.IraqIrelandIsraelItalyJamaicaJapanJordanKazakhstanKenyaKorea, Dem. People’s Rep.Korea, Rep.KuwaitKyrgyz RepublicLao PDRLate-demographic dividendLatin America & Caribbean Latin America & Caribbean (excluding high income)Latin America & the Caribbean (IDA & IBRD countries)LatviaLeast developed countries: UN classificationLebanonLesothoLiberiaLibyaLithuaniaLow & middle incomeLow incomeLower middle incomeLuxembourgMacedonia, FYRMadagascarMalawiMalaysiaMaldivesMaliMaltaMauritaniaMauritiusMexicoMicronesia, Fed. Sts.Middle East & North AfricaMiddle East & North Africa (excluding high income)Middle East & North Africa (IDA & IBRD countries)Middle incomeMoldovaMongoliaMontenegroMoroccoMozambiqueMyanmarNamibiaNepalNetherlandsNew CaledoniaNew ZealandNicaraguaNigerNigeriaNorth AmericaNorwayOECD membersOmanOther small statesPacific island small statesPakistanPanamaPapua New GuineaParaguayPeruPhilippinesPolandPortugalPost-demographic dividendPre-demographic dividendPuerto RicoQatarRomaniaRussian FederationRwandaSao Tome and PrincipeSaudi ArabiaSenegalSerbiaSierra LeoneSlovak RepublicSloveniaSmall statesSolomon IslandsSomaliaSouth AfricaSouth AsiaSouth Asia (IDA & IBRD)South SudanSpainSri LankaSt. LuciaSt. Vincent and the GrenadinesSub-Saharan Africa Sub-Saharan Africa (excluding high income)Sub-Saharan Africa (IDA & IBRD countries)SudanSurinameSwazilandSwedenSwitzerlandSyrian Arab RepublicTajikistanTanzaniaThailandTimor-LesteTogoTrinidad and TobagoTunisiaTurkeyTurkmenistanUgandaUkraineUnited Arab EmiratesUnited KingdomUnited StatesUpper middle incomeUruguayUzbekistanVanuatuVenezuela, RBVietnamWest Bank and GazaWorldYemen, Rep.ZambiaZimbabwe Timeline:
This timeline shows a graph from 1962 to 2015 of Fragile and conflict affected situations. No data until 1961. Number of actual observations by date: 54.
Source name:
World Development Indicators
Source organization:
Food and Agriculture Organization, electronic files and web site.
Categories, topics:
Agriculture & Rural Development
Last updated:
apr 23, 2017
Indicators value changes by year
Minimum:
23.155 mln
jan 1, 1967
Maximum:
81.128 mln
jan 1, 2015
At the date of observation
Value
Absolute change
Change from previous value
jan 1, 1962
23.644 mln
+23.644 mln
0.0%
jan 1, 1963
26.347 mln
+2.703 mln
11.43%
jan 1, 1964
25.208 mln
-1.139 mln
-4.32%
jan 1, 1965
25.954 mln
+745.927K
2.96%
jan 1, 1966
25.842 mln
-112.264K
-0.43%
jan 1, 1967
23.155 mln
-2.687 mln
-10.4%
jan 1, 1968
28.013 mln
+4.858 mln
20.98%
jan 1, 1969
26.749 mln
-1.264 mln
-4.51%
jan 1, 1970
28.65 mln
+1.9 mln
7.1%
jan 1, 1971
26.537 mln
-2.112 mln
-7.37%
jan 1, 1972
27.165 mln
+627.807K
2.37%
jan 1, 1973
30.37 mln
+3.205 mln
11.8%
jan 1, 1974
26.858 mln
-3.512 mln
-11.56%
jan 1, 1975
30.908 mln
+4.051 mln
15.08%
jan 1, 1976
31.832 mln
+923.575K
2.99%
jan 1, 1977
34.017 mln
+2.185 mln
6.87%
jan 1, 1978
30.647 mln
-3.37 mln
-9.91%
jan 1, 1979
33.733 mln
+3.086 mln
10.07%
jan 1, 1980
30.636 mln
-3.097 mln
-9.18%
jan 1, 1981
37.15 mln
+6.515 mln
21.26%
jan 1, 1982
40.698 mln
+3.548 mln
9.55%
jan 1, 1983
36.848 mln
-3.851 mln
-9.46%
jan 1, 1984
36.27 mln
-577.87K
-1.57%
jan 1, 1985
33.292 mln
-2.978 mln
-8.21%
jan 1, 1986
41.777 mln
+8.485 mln
25.49%
jan 1, 1987
41.333 mln
-444.464K
-1.06%
jan 1, 1988
35.632 mln
-5.701 mln
-13.79%
jan 1, 1989
44.569 mln
+8.937 mln
25.08%
jan 1, 1990
37.033 mln
-7.535 mln
-16.91%
jan 1, 1991
39.61 mln
+2.577 mln
6.96%
jan 1, 1992
40.726 mln
+1.115 mln
2.82%
jan 1, 1993
42.731 mln
+2.005 mln
4.92%
jan 1, 1994
46.637 mln
+3.906 mln
9.14%
jan 1, 1995
51.062 mln
+4.426 mln
9.49%
jan 1, 1996
46.848 mln
-4.215 mln
-8.25%
jan 1, 1997
51.148 mln
+4.3 mln
9.18%
jan 1, 1998
47.147 mln
-4.001 mln
-7.82%
jan 1, 1999
50.273 mln
+3.125 mln
6.63%
jan 1, 2000
47.938 mln
-2.335 mln
-4.64%
jan 1, 2001
47.008 mln
-929.502K
-1.94%
jan 1, 2002
54.788 mln
+7.78 mln
16.55%
jan 1, 2003
54.703 mln
-84.806K
-0.15%
jan 1, 2004
61.169 mln
+6.466 mln
11.82%
jan 1, 2005
58.685 mln
-2.484 mln
-4.06%
jan 1, 2006
68.381 mln
+9.695 mln
16.52%
jan 1, 2007
73.014 mln
+4.633 mln
6.78%
jan 1, 2008
73.792 mln
+778.009K
1.07%
jan 1, 2009
68.214 mln
-5.578 mln
-7.56%
jan 1, 2010
76.259 mln
+8.045 mln
11.79%
jan 1, 2011
78.396 mln
+2.137 mln
2.8%
jan 1, 2012
72.943 mln
-5.453 mln
-6.96%
jan 1, 2013
74.241 mln
+1.298 mln
1.78%
jan 1, 2014
77.216 mln
+2.975 mln
4.01%
jan 1, 2015
81.128 mln
+3.912 mln
5.07%
Ranking of countries by current statistics by years


Comments: