29
/
en
AIzaSyAYiBZKx7MnpbEhh9jyipgxe19OcubqV5w
April 1, 2024
61399
Upper middle income
UMC
false
2
1
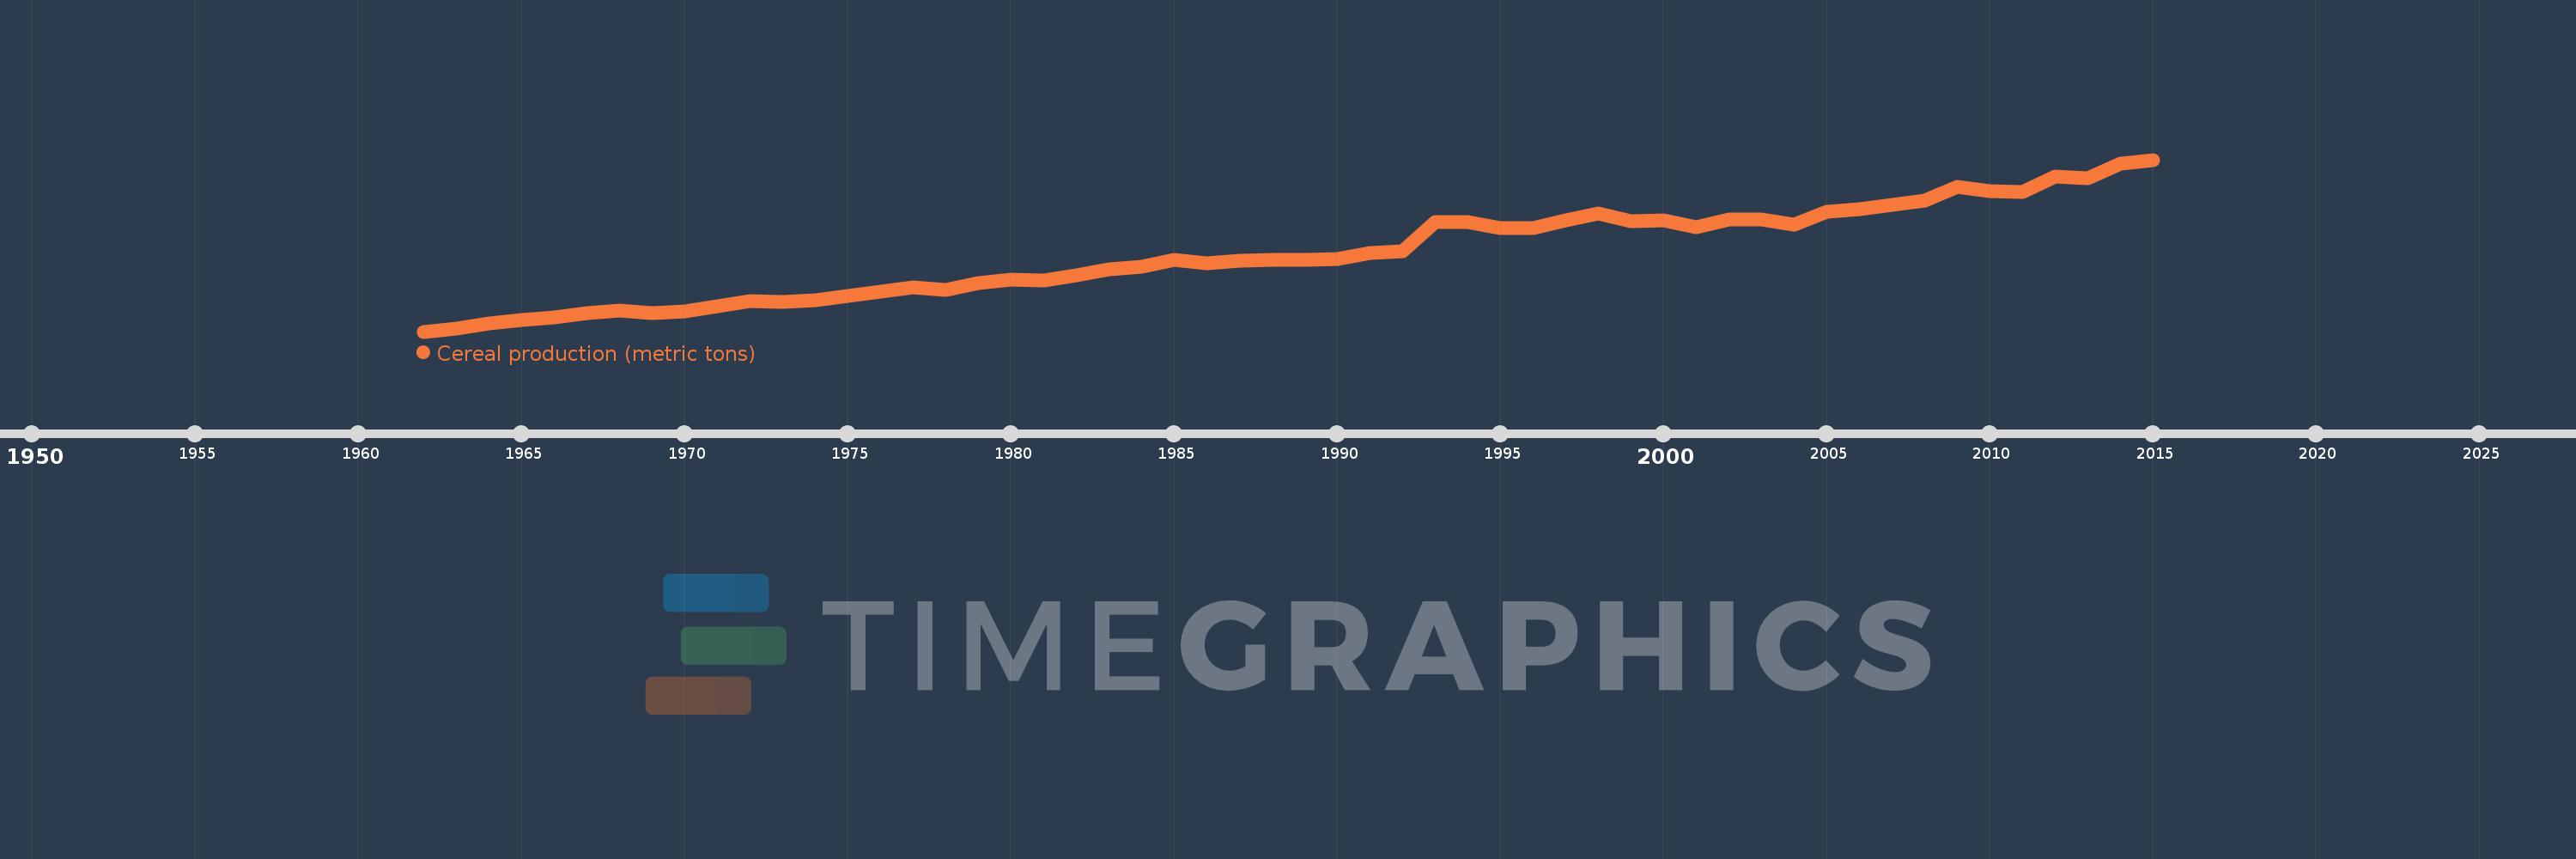
Cereal production (metric tons)
2015,2014,2013,2012,2011,2010,2009,2008,2007,2006,2005,2004,2003,2002,2001,2000,1999,1998,1997,1996,1995,1994,1993,1992,1991,1990,1989,1988,1987,1986,1985,1984,1983,1982,1981,1980,1979,1978,1977,1976,1975,1974,1973,1972,1971,1970,1969,1968,1967,1966,1965,1964,1963,1962
This statistics in other country:
AfghanistanAlbaniaAlgeriaAngolaAntigua and BarbudaArab WorldArgentinaArmeniaAustraliaAustriaAzerbaijanBahamas, TheBangladeshBarbadosBelarusBelgiumBelizeBeninBhutanBoliviaBosnia and HerzegovinaBotswanaBrazilBrunei DarussalamBulgariaBurkina FasoBurundiCabo VerdeCambodiaCameroonCanadaCaribbean small statesCentral African RepublicCentral Europe and the BalticsChadChileChinaColombiaComorosCongo, Dem. Rep.Congo, Rep.Costa RicaCote d'IvoireCroatiaCubaCyprusCzech RepublicDenmarkDjiboutiDominicaDominican RepublicEarly-demographic dividendEast Asia & PacificEast Asia & Pacific (excluding high income)East Asia & Pacific (IDA & IBRD countries)EcuadorEgypt, Arab Rep.El SalvadorEritreaEstoniaEthiopiaEuro areaEurope & Central AsiaEurope & Central Asia (excluding high income)Europe & Central Asia (IDA & IBRD countries)European UnionFijiFinlandFragile and conflict affected situationsFranceGabonGambia, TheGeorgiaGermanyGhanaGreeceGrenadaGuamGuatemalaGuineaGuinea-BissauGuyanaHaitiHeavily indebted poor countries (HIPC)High incomeHondurasHong Kong SAR, ChinaHungaryIBRD onlyIDA & IBRD totalIDA blendIDA onlyIDA totalIndiaIndonesiaIran, Islamic Rep.IraqIrelandIsraelItalyJamaicaJapanJordanKazakhstanKenyaKorea, Dem. People’s Rep.Korea, Rep.KuwaitKyrgyz RepublicLao PDRLate-demographic dividendLatin America & Caribbean Latin America & Caribbean (excluding high income)Latin America & the Caribbean (IDA & IBRD countries)LatviaLeast developed countries: UN classificationLebanonLesothoLiberiaLibyaLithuaniaLow & middle incomeLow incomeLower middle incomeLuxembourgMacedonia, FYRMadagascarMalawiMalaysiaMaldivesMaliMaltaMauritaniaMauritiusMexicoMicronesia, Fed. Sts.Middle East & North AfricaMiddle East & North Africa (excluding high income)Middle East & North Africa (IDA & IBRD countries)Middle incomeMoldovaMongoliaMontenegroMoroccoMozambiqueMyanmarNamibiaNepalNetherlandsNew CaledoniaNew ZealandNicaraguaNigerNigeriaNorth AmericaNorwayOECD membersOmanOther small statesPacific island small statesPakistanPanamaPapua New GuineaParaguayPeruPhilippinesPolandPortugalPost-demographic dividendPre-demographic dividendPuerto RicoQatarRomaniaRussian FederationRwandaSao Tome and PrincipeSaudi ArabiaSenegalSerbiaSierra LeoneSlovak RepublicSloveniaSmall statesSolomon IslandsSomaliaSouth AfricaSouth AsiaSouth Asia (IDA & IBRD)South SudanSpainSri LankaSt. LuciaSt. Vincent and the GrenadinesSub-Saharan Africa Sub-Saharan Africa (excluding high income)Sub-Saharan Africa (IDA & IBRD countries)SudanSurinameSwazilandSwedenSwitzerlandSyrian Arab RepublicTajikistanTanzaniaThailandTimor-LesteTogoTrinidad and TobagoTunisiaTurkeyTurkmenistanUgandaUkraineUnited Arab EmiratesUnited KingdomUnited StatesUpper middle incomeUruguayUzbekistanVanuatuVenezuela, RBVietnamWest Bank and GazaWorldYemen, Rep.ZambiaZimbabwe Timeline:
This timeline shows a graph from 1962 to 2015 of Upper middle income. No data until 1961. Number of actual observations by date: 54.
Source name:
World Development Indicators
Source organization:
Food and Agriculture Organization, electronic files and web site.
Categories, topics:
Agriculture & Rural Development
Last updated:
apr 23, 2017
Indicators value changes by year
Minimum:
204.637 mln
jan 1, 1962
Maximum:
1.07 bln
jan 1, 2015
At the date of observation
Value
Absolute change
Change from previous value
jan 1, 1962
204.637 mln
+204.637 mln
0.0%
jan 1, 1963
220.802 mln
+16.165 mln
7.9%
jan 1, 1964
246.387 mln
+25.585 mln
11.59%
jan 1, 1965
263.354 mln
+16.967 mln
6.89%
jan 1, 1966
274.524 mln
+11.17 mln
4.24%
jan 1, 1967
298.551 mln
+24.027 mln
8.75%
jan 1, 1968
310.813 mln
+12.263 mln
4.11%
jan 1, 1969
299.741 mln
-11.072 mln
-3.56%
jan 1, 1970
304.978 mln
+5.237 mln
1.75%
jan 1, 1971
334.157 mln
+29.179 mln
9.57%
jan 1, 1972
357.729 mln
+23.572 mln
7.05%
jan 1, 1973
352.014 mln
-5.715 mln
-1.6%
jan 1, 1974
362.74 mln
+10.726 mln
3.05%
jan 1, 1975
385.151 mln
+22.41 mln
6.18%
jan 1, 1976
406.975 mln
+21.824 mln
5.67%
jan 1, 1977
426.124 mln
+19.149 mln
4.71%
jan 1, 1978
413.357 mln
-12.767 mln
-3.0%
jan 1, 1979
448.346 mln
+34.99 mln
8.46%
jan 1, 1980
465.246 mln
+16.9 mln
3.77%
jan 1, 1981
461.502 mln
-3.744 mln
-0.8%
jan 1, 1982
486.81 mln
+25.308 mln
5.48%
jan 1, 1983
516.858 mln
+30.049 mln
6.17%
jan 1, 1984
532.053 mln
+15.195 mln
2.94%
jan 1, 1985
565.815 mln
+33.762 mln
6.35%
jan 1, 1986
547.142 mln
-18.673 mln
-3.3%
jan 1, 1987
559.583 mln
+12.441 mln
2.27%
jan 1, 1988
566.424 mln
+6.841 mln
1.22%
jan 1, 1989
564.192 mln
-2.232 mln
-0.39%
jan 1, 1990
571.35 mln
+7.158 mln
1.27%
jan 1, 1991
602.054 mln
+30.704 mln
5.37%
jan 1, 1992
610.725 mln
+8.671 mln
1.44%
jan 1, 1993
757.611 mln
+146.887 mln
24.05%
jan 1, 1994
754.586 mln
-3.026 mln
-0.4%
jan 1, 1995
725.825 mln
-28.761 mln
-3.81%
jan 1, 1996
727.116 mln
+1.291 mln
0.18%
jan 1, 1997
766.736 mln
+39.62 mln
5.45%
jan 1, 1998
799.091 mln
+32.355 mln
4.22%
jan 1, 1999
762.582 mln
-36.509 mln
-4.57%
jan 1, 2000
763.107 mln
+524.034K
0.07%
jan 1, 2001
729.327 mln
-33.78 mln
-4.43%
jan 1, 2002
769.515 mln
+40.189 mln
5.51%
jan 1, 2003
769.085 mln
-430.251K
-0.06%
jan 1, 2004
742.112 mln
-26.973 mln
-3.51%
jan 1, 2005
808.727 mln
+66.616 mln
8.98%
jan 1, 2006
820.666 mln
+11.938 mln
1.48%
jan 1, 2007
842.778 mln
+22.112 mln
2.69%
jan 1, 2008
864.985 mln
+22.208 mln
2.64%
jan 1, 2009
934.529 mln
+69.544 mln
8.04%
jan 1, 2010
911.997 mln
-22.532 mln
-2.41%
jan 1, 2011
908.628 mln
-3.368 mln
-0.37%
jan 1, 2012
986.952 mln
+78.324 mln
8.62%
jan 1, 2013
978.62 mln
-8.332 mln
-0.84%
jan 1, 2014
1.052 bln
+73.634 mln
7.52%
jan 1, 2015
1.07 bln
+17.594 mln
1.67%
Ranking of countries by current statistics by years


Comments: