29
/
en
AIzaSyAYiBZKx7MnpbEhh9jyipgxe19OcubqV5w
April 1, 2024
257090
Switzerland
CHE
true
2
1
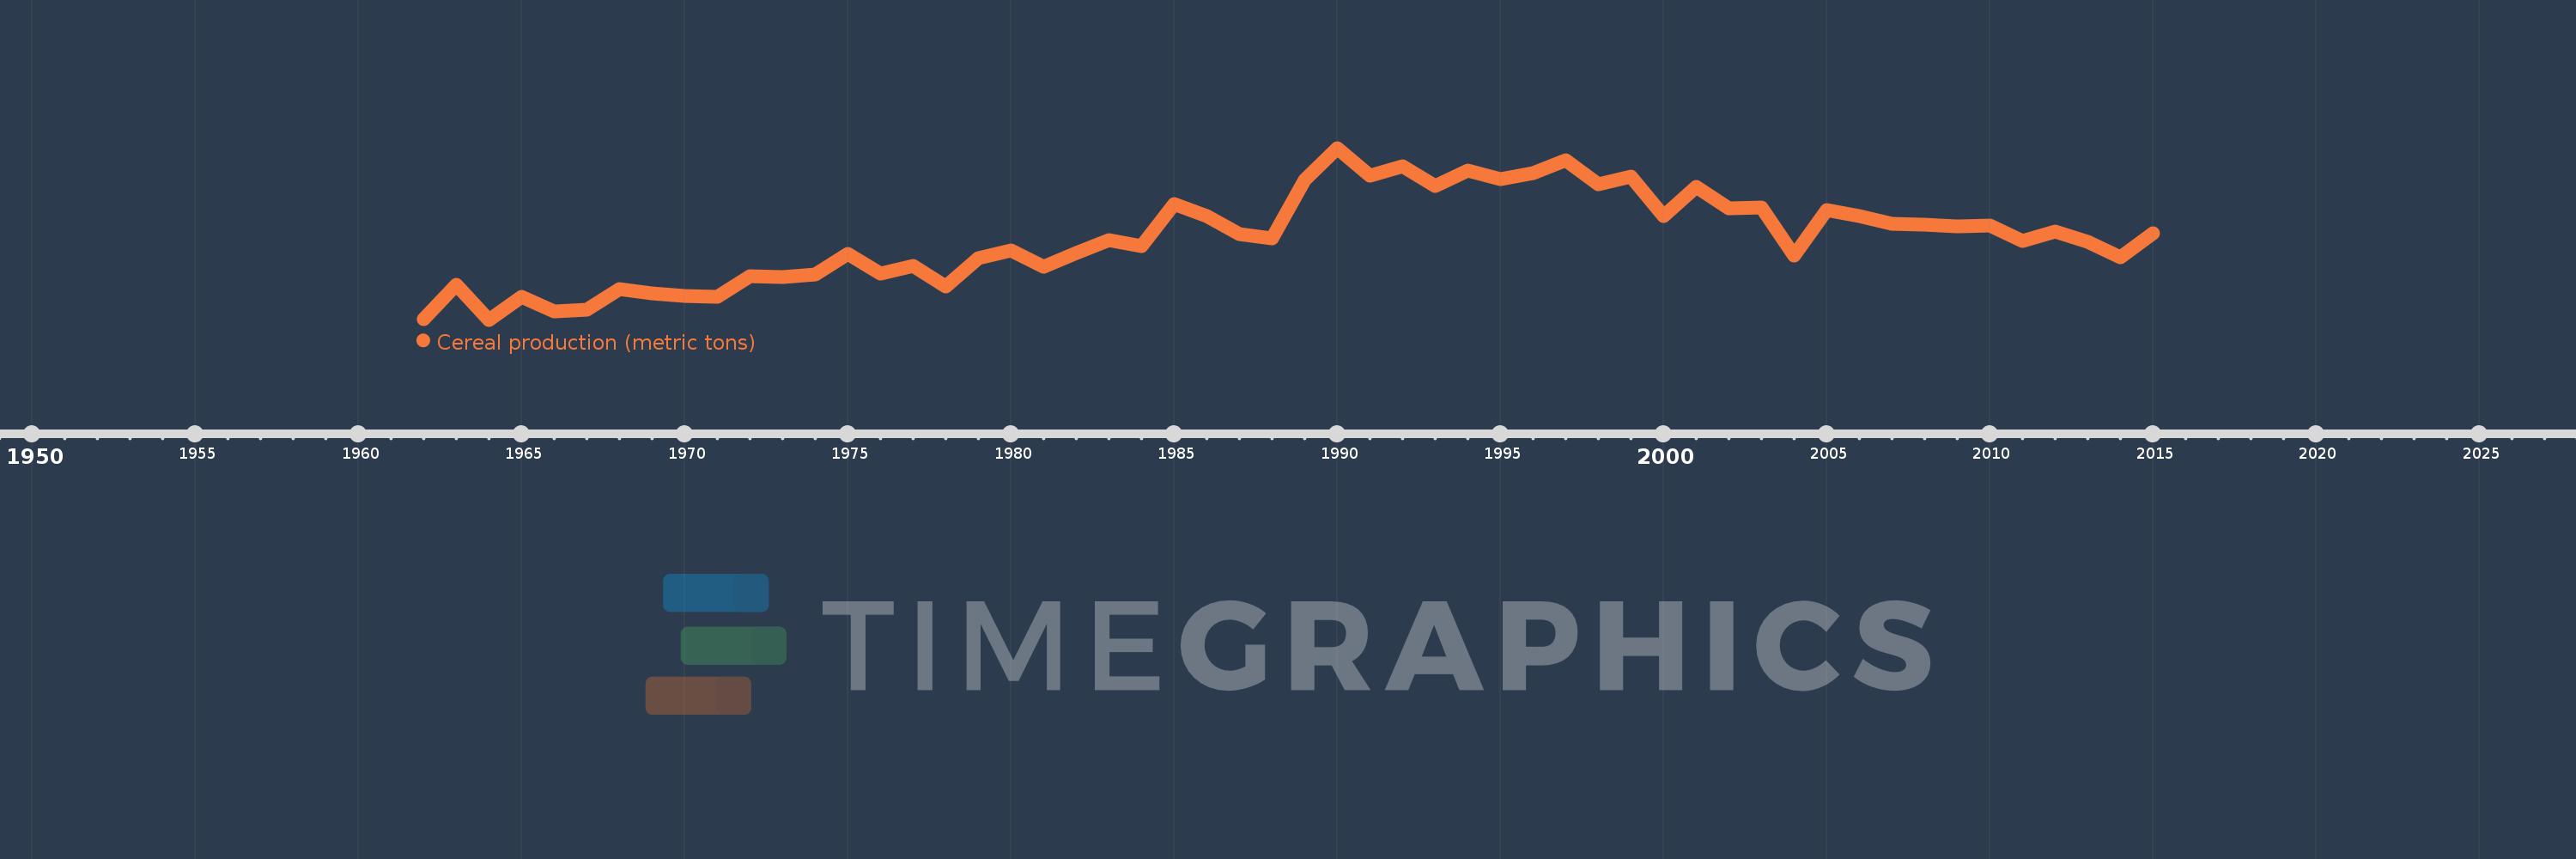
Cereal production (metric tons)
2015,2014,2013,2012,2011,2010,2009,2008,2007,2006,2005,2004,2003,2002,2001,2000,1999,1998,1997,1996,1995,1994,1993,1992,1991,1990,1989,1988,1987,1986,1985,1984,1983,1982,1981,1980,1979,1978,1977,1976,1975,1974,1973,1972,1971,1970,1969,1968,1967,1966,1965,1964,1963,1962
This statistics in other country:
AfghanistanAlbaniaAlgeriaAngolaAntigua and BarbudaArab WorldArgentinaArmeniaAustraliaAustriaAzerbaijanBahamas, TheBangladeshBarbadosBelarusBelgiumBelizeBeninBhutanBoliviaBosnia and HerzegovinaBotswanaBrazilBrunei DarussalamBulgariaBurkina FasoBurundiCabo VerdeCambodiaCameroonCanadaCaribbean small statesCentral African RepublicCentral Europe and the BalticsChadChileChinaColombiaComorosCongo, Dem. Rep.Congo, Rep.Costa RicaCote d'IvoireCroatiaCubaCyprusCzech RepublicDenmarkDjiboutiDominicaDominican RepublicEarly-demographic dividendEast Asia & PacificEast Asia & Pacific (excluding high income)East Asia & Pacific (IDA & IBRD countries)EcuadorEgypt, Arab Rep.El SalvadorEritreaEstoniaEthiopiaEuro areaEurope & Central AsiaEurope & Central Asia (excluding high income)Europe & Central Asia (IDA & IBRD countries)European UnionFijiFinlandFragile and conflict affected situationsFranceGabonGambia, TheGeorgiaGermanyGhanaGreeceGrenadaGuamGuatemalaGuineaGuinea-BissauGuyanaHaitiHeavily indebted poor countries (HIPC)High incomeHondurasHong Kong SAR, ChinaHungaryIBRD onlyIDA & IBRD totalIDA blendIDA onlyIDA totalIndiaIndonesiaIran, Islamic Rep.IraqIrelandIsraelItalyJamaicaJapanJordanKazakhstanKenyaKorea, Dem. People’s Rep.Korea, Rep.KuwaitKyrgyz RepublicLao PDRLate-demographic dividendLatin America & Caribbean Latin America & Caribbean (excluding high income)Latin America & the Caribbean (IDA & IBRD countries)LatviaLeast developed countries: UN classificationLebanonLesothoLiberiaLibyaLithuaniaLow & middle incomeLow incomeLower middle incomeLuxembourgMacedonia, FYRMadagascarMalawiMalaysiaMaldivesMaliMaltaMauritaniaMauritiusMexicoMicronesia, Fed. Sts.Middle East & North AfricaMiddle East & North Africa (excluding high income)Middle East & North Africa (IDA & IBRD countries)Middle incomeMoldovaMongoliaMontenegroMoroccoMozambiqueMyanmarNamibiaNepalNetherlandsNew CaledoniaNew ZealandNicaraguaNigerNigeriaNorth AmericaNorwayOECD membersOmanOther small statesPacific island small statesPakistanPanamaPapua New GuineaParaguayPeruPhilippinesPolandPortugalPost-demographic dividendPre-demographic dividendPuerto RicoQatarRomaniaRussian FederationRwandaSao Tome and PrincipeSaudi ArabiaSenegalSerbiaSierra LeoneSlovak RepublicSloveniaSmall statesSolomon IslandsSomaliaSouth AfricaSouth AsiaSouth Asia (IDA & IBRD)South SudanSpainSri LankaSt. LuciaSt. Vincent and the GrenadinesSub-Saharan Africa Sub-Saharan Africa (excluding high income)Sub-Saharan Africa (IDA & IBRD countries)SudanSurinameSwazilandSwedenSwitzerlandSyrian Arab RepublicTajikistanTanzaniaThailandTimor-LesteTogoTrinidad and TobagoTunisiaTurkeyTurkmenistanUgandaUkraineUnited Arab EmiratesUnited KingdomUnited StatesUpper middle incomeUruguayUzbekistanVanuatuVenezuela, RBVietnamWest Bank and GazaWorldYemen, Rep.ZambiaZimbabwe Timeline:
This timeline shows a graph from 1962 to 2015 of Switzerland. No data until 1961. Number of actual observations by date: 54.
Source name:
World Development Indicators
Source organization:
Food and Agriculture Organization, electronic files and web site.
Categories, topics:
Agriculture & Rural Development
Last updated:
apr 23, 2017
Indicators value changes by year
Minimum:
514.7K
jan 1, 1964
Maximum:
1.411 mln
jan 1, 1990
At the date of observation
Value
Absolute change
Change from previous value
jan 1, 1962
517.8K
+517.8K
0.0%
jan 1, 1963
697.4K
+179.6K
34.69%
jan 1, 1964
514.7K
-182.7K
-26.2%
jan 1, 1965
632.2K
+117.5K
22.83%
jan 1, 1966
557.9K
-74.3K
-11.75%
jan 1, 1967
566.6K
+8.7K
1.56%
jan 1, 1968
672.8K
+106.2K
18.74%
jan 1, 1969
652.6K
-20.2K
-3.0%
jan 1, 1970
640.4K
-12.2K
-1.87%
jan 1, 1971
633.7K
-6.7K
-1.05%
jan 1, 1972
743.0K
+109.3K
17.25%
jan 1, 1973
738.4K
-4.6K
-0.62%
jan 1, 1974
749.6K
+11.2K
1.52%
jan 1, 1975
856.8K
+107.2K
14.3%
jan 1, 1976
756.9K
-99.9K
-11.66%
jan 1, 1977
795.5K
+38.6K
5.1%
jan 1, 1978
690.0K
-105.5K
-13.26%
jan 1, 1979
835.1K
+145.1K
21.03%
jan 1, 1980
875.0K
+39.9K
4.78%
jan 1, 1981
789.1K
-85.9K
-9.82%
jan 1, 1982
863.5K
+74.4K
9.43%
jan 1, 1983
928.9K
+65.4K
7.57%
jan 1, 1984
899.6K
-29.3K
-3.15%
jan 1, 1985
1.118 mln
+218.6K
24.3%
jan 1, 1986
1.054 mln
-63.8K
-5.71%
jan 1, 1987
959.9K
-94.5K
-8.96%
jan 1, 1988
939.0K
-20.9K
-2.18%
jan 1, 1989
1.244 mln
+304.7K
32.45%
jan 1, 1990
1.411 mln
+167.0K
13.43%
jan 1, 1991
1.268 mln
-142.7K
-10.12%
jan 1, 1992
1.313 mln
+45.1K
3.56%
jan 1, 1993
1.213 mln
-100.0K
-7.62%
jan 1, 1994
1.292 mln
+79.2K
6.53%
jan 1, 1995
1.249 mln
-42.9K
-3.32%
jan 1, 1996
1.281 mln
+31.427K
2.52%
jan 1, 1997
1.347 mln
+66.653K
5.2%
jan 1, 1998
1.223 mln
-124.45K
-9.24%
jan 1, 1999
1.263 mln
+40.17K
3.28%
jan 1, 2000
1.055 mln
-207.8K
-16.45%
jan 1, 2001
1.206 mln
+150.4K
14.25%
jan 1, 2002
1.094 mln
-111.9K
-9.28%
jan 1, 2003
1.101 mln
+7.1K
0.65%
jan 1, 2004
847.2K
-253.8K
-23.05%
jan 1, 2005
1.089 mln
+241.8K
28.54%
jan 1, 2006
1.056 mln
-32.5K
-2.98%
jan 1, 2007
1.013 mln
-43.3K
-4.1%
jan 1, 2008
1.012 mln
-1.3K
-0.13%
jan 1, 2009
1.002 mln
-10.256K
-1.01%
jan 1, 2010
1.006 mln
+4.54K
0.45%
jan 1, 2011
924.003K
-82.181K
-8.17%
jan 1, 2012
972.872K
+48.869K
5.29%
jan 1, 2013
922.219K
-50.653K
-5.21%
jan 1, 2014
838.486K
-83.733K
-9.08%
jan 1, 2015
964.087K
+125.601K
14.98%
Ranking of countries by current statistics by years


Comments: