29
/
en
AIzaSyAYiBZKx7MnpbEhh9jyipgxe19OcubqV5w
April 1, 2024
193953
Mauritius
MUS
true
2
1
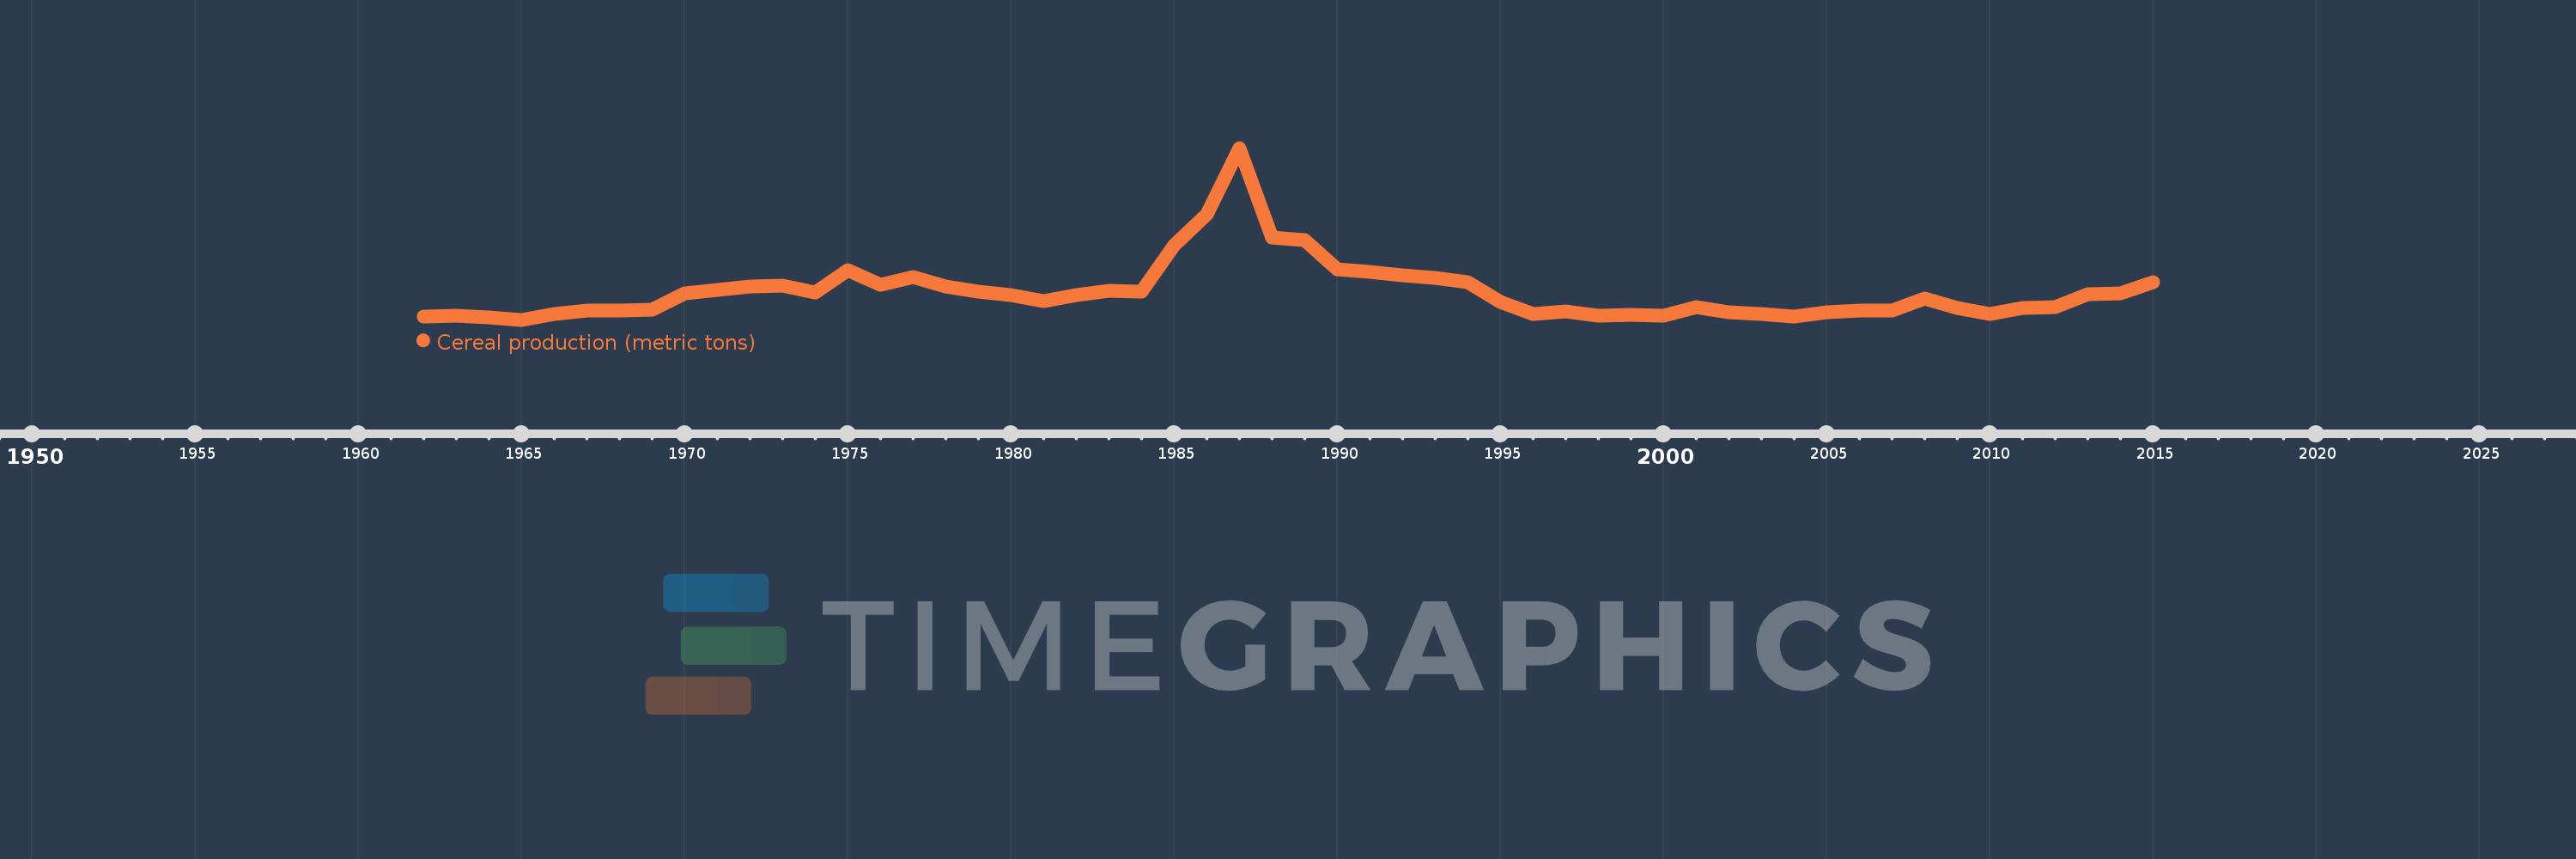
Cereal production (metric tons)
2015,2014,2013,2012,2011,2010,2009,2008,2007,2006,2005,2004,2003,2002,2001,2000,1999,1998,1997,1996,1995,1994,1993,1992,1991,1990,1989,1988,1987,1986,1985,1984,1983,1982,1981,1980,1979,1978,1977,1976,1975,1974,1973,1972,1971,1970,1969,1968,1967,1966,1965,1964,1963,1962
This statistics in other country:
AfghanistanAlbaniaAlgeriaAngolaAntigua and BarbudaArab WorldArgentinaArmeniaAustraliaAustriaAzerbaijanBahamas, TheBangladeshBarbadosBelarusBelgiumBelizeBeninBhutanBoliviaBosnia and HerzegovinaBotswanaBrazilBrunei DarussalamBulgariaBurkina FasoBurundiCabo VerdeCambodiaCameroonCanadaCaribbean small statesCentral African RepublicCentral Europe and the BalticsChadChileChinaColombiaComorosCongo, Dem. Rep.Congo, Rep.Costa RicaCote d'IvoireCroatiaCubaCyprusCzech RepublicDenmarkDjiboutiDominicaDominican RepublicEarly-demographic dividendEast Asia & PacificEast Asia & Pacific (excluding high income)East Asia & Pacific (IDA & IBRD countries)EcuadorEgypt, Arab Rep.El SalvadorEritreaEstoniaEthiopiaEuro areaEurope & Central AsiaEurope & Central Asia (excluding high income)Europe & Central Asia (IDA & IBRD countries)European UnionFijiFinlandFragile and conflict affected situationsFranceGabonGambia, TheGeorgiaGermanyGhanaGreeceGrenadaGuamGuatemalaGuineaGuinea-BissauGuyanaHaitiHeavily indebted poor countries (HIPC)High incomeHondurasHong Kong SAR, ChinaHungaryIBRD onlyIDA & IBRD totalIDA blendIDA onlyIDA totalIndiaIndonesiaIran, Islamic Rep.IraqIrelandIsraelItalyJamaicaJapanJordanKazakhstanKenyaKorea, Dem. People’s Rep.Korea, Rep.KuwaitKyrgyz RepublicLao PDRLate-demographic dividendLatin America & Caribbean Latin America & Caribbean (excluding high income)Latin America & the Caribbean (IDA & IBRD countries)LatviaLeast developed countries: UN classificationLebanonLesothoLiberiaLibyaLithuaniaLow & middle incomeLow incomeLower middle incomeLuxembourgMacedonia, FYRMadagascarMalawiMalaysiaMaldivesMaliMaltaMauritaniaMauritiusMexicoMicronesia, Fed. Sts.Middle East & North AfricaMiddle East & North Africa (excluding high income)Middle East & North Africa (IDA & IBRD countries)Middle incomeMoldovaMongoliaMontenegroMoroccoMozambiqueMyanmarNamibiaNepalNetherlandsNew CaledoniaNew ZealandNicaraguaNigerNigeriaNorth AmericaNorwayOECD membersOmanOther small statesPacific island small statesPakistanPanamaPapua New GuineaParaguayPeruPhilippinesPolandPortugalPost-demographic dividendPre-demographic dividendPuerto RicoQatarRomaniaRussian FederationRwandaSao Tome and PrincipeSaudi ArabiaSenegalSerbiaSierra LeoneSlovak RepublicSloveniaSmall statesSolomon IslandsSomaliaSouth AfricaSouth AsiaSouth Asia (IDA & IBRD)South SudanSpainSri LankaSt. LuciaSt. Vincent and the GrenadinesSub-Saharan Africa Sub-Saharan Africa (excluding high income)Sub-Saharan Africa (IDA & IBRD countries)SudanSurinameSwazilandSwedenSwitzerlandSyrian Arab RepublicTajikistanTanzaniaThailandTimor-LesteTogoTrinidad and TobagoTunisiaTurkeyTurkmenistanUgandaUkraineUnited Arab EmiratesUnited KingdomUnited StatesUpper middle incomeUruguayUzbekistanVanuatuVenezuela, RBVietnamWest Bank and GazaWorldYemen, Rep.ZambiaZimbabwe Timeline:
This timeline shows a graph from 1962 to 2015 of Mauritius. No data until 1961. Number of actual observations by date: 54.
Source name:
World Development Indicators
Source organization:
Food and Agriculture Organization, electronic files and web site.
Categories, topics:
Agriculture & Rural Development
Last updated:
apr 23, 2017
Indicators value changes by year
Maximum:
8.145K
jan 1, 1987
At the date of observation
Value
Absolute change
Change from previous value
jan 1, 1962
180.0
+180.0
0.0%
jan 1, 1963
203.0
+23.0
12.78%
jan 1, 1964
147.0
-56.0
-27.59%
jan 1, 1965
25.0
-122.0
-82.99%
jan 1, 1966
296.0
+271.0
1.08K%
jan 1, 1967
457.0
+161.0
54.39%
jan 1, 1968
462.0
+5.0
1.09%
jan 1, 1969
494.0
+32.0
6.93%
jan 1, 1970
1.275K
+781.0
158.1%
jan 1, 1971
1.435K
+160.0
12.55%
jan 1, 1972
1.588K
+153.0
10.66%
jan 1, 1973
1.619K
+31.0
1.95%
jan 1, 1974
1.325K
-294.0
-18.16%
jan 1, 1975
2.352K
+1.027K
77.51%
jan 1, 1976
1.69K
-662.0
-28.15%
jan 1, 1977
2.049K
+359.0
21.24%
jan 1, 1978
1.603K
-446.0
-21.77%
jan 1, 1979
1.341K
-262.0
-16.34%
jan 1, 1980
1.209K
-132.0
-9.84%
jan 1, 1981
891.0
-318.0
-26.3%
jan 1, 1982
1.208K
+317.0
35.58%
jan 1, 1983
1.385K
+177.0
14.65%
jan 1, 1984
1.34K
-45.0
-3.25%
jan 1, 1985
3.54K
+2.2K
164.18%
jan 1, 1986
5.025K
+1.485K
41.95%
jan 1, 1987
8.145K
+3.12K
62.09%
jan 1, 1988
3.905K
-4.24K
-52.06%
jan 1, 1989
3.807K
-98.0
-2.51%
jan 1, 1990
2.415K
-1.392K
-36.56%
jan 1, 1991
2.284K
-131.0
-5.42%
jan 1, 1992
2.13K
-154.0
-6.74%
jan 1, 1993
2.0K
-130.0
-6.1%
jan 1, 1994
1.816K
-184.0
-9.2%
jan 1, 1995
880.0
-936.0
-51.54%
jan 1, 1996
289.0
-591.0
-67.16%
jan 1, 1997
438.0
+149.0
51.56%
jan 1, 1998
232.0
-206.0
-47.03%
jan 1, 1999
259.0
+27.0
11.64%
jan 1, 2000
201.0
-58.0
-22.39%
jan 1, 2001
623.0
+422.0
209.95%
jan 1, 2002
389.0
-234.0
-37.56%
jan 1, 2003
295.0
-94.0
-24.16%
jan 1, 2004
177.0
-118.0
-40.0%
jan 1, 2005
369.0
+192.0
108.47%
jan 1, 2006
475.0
+106.0
28.73%
jan 1, 2007
452.0
-23.0
-4.84%
jan 1, 2008
1.021K
+569.0
125.88%
jan 1, 2009
575.0
-446.0
-43.68%
jan 1, 2010
313.0
-262.0
-45.57%
jan 1, 2011
562.0
+249.0
79.55%
jan 1, 2012
636.0
+74.0
13.17%
jan 1, 2013
1.244K
+608.0
95.6%
jan 1, 2014
1.278K
+34.0
2.73%
jan 1, 2015
1.811K
+533.0
41.71%
Ranking of countries by current statistics by years


Comments: