29
/
en
AIzaSyAYiBZKx7MnpbEhh9jyipgxe19OcubqV5w
April 1, 2024
272647
Uganda
UGA
true
2
1
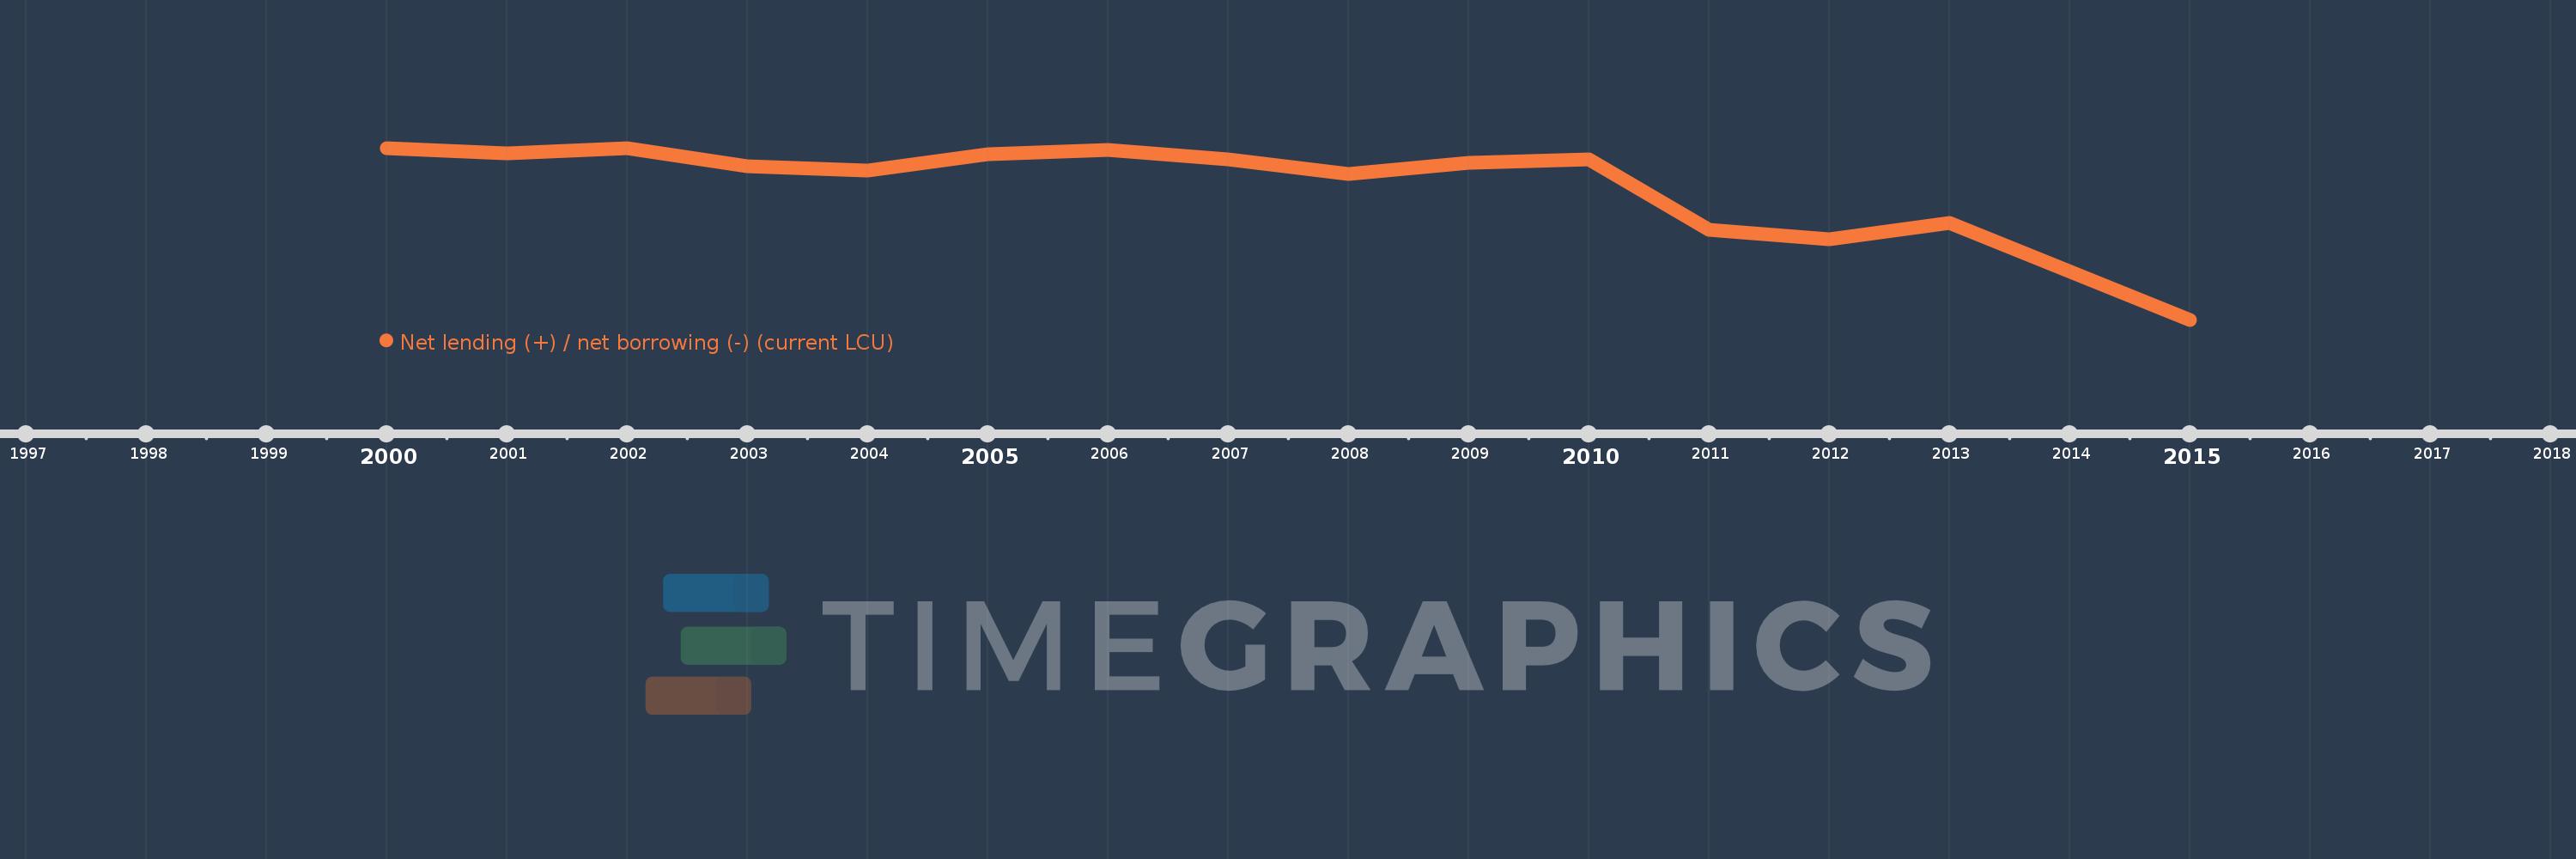
Net lending (+) / net borrowing (-) (current LCU)
2015,2013,2012,2011,2010,2009,2008,2007,2006,2005,2004,2003,2002,2001,2000
This statistics in other country:
AfghanistanAlbaniaAlgeriaAngolaAntigua and BarbudaArmeniaAustraliaAustriaAzerbaijanBahamas, TheBahrainBangladeshBarbadosBelarusBelgiumBelizeBhutanBoliviaBosnia and HerzegovinaBrazilBurundiCabo VerdeCambodiaCanadaCentral African RepublicChileCongo, Dem. Rep.Congo, Rep.Costa RicaCote d'IvoireCroatiaCyprusCzech RepublicDenmarkDominicaDominican RepublicEgypt, Arab Rep.El SalvadorEquatorial GuineaEstoniaEthiopiaFijiFinlandFranceGambia, TheGeorgiaGermanyGreeceGuatemalaHondurasHungaryIcelandIndiaIndonesiaIran, Islamic Rep.IraqIrelandIsraelItalyJamaicaKazakhstanKiribatiKorea, Rep.Kyrgyz RepublicLao PDRLatviaLebanonLithuaniaLuxembourgMacao SAR, ChinaMacedonia, FYRMadagascarMalawiMaldivesMaliMaltaMauritiusMexicoMicronesia, Fed. Sts.MoldovaMongoliaMoroccoMozambiqueNamibiaNepalNetherlandsNew ZealandNicaraguaNigeriaNorwayOmanPakistanParaguayPeruPhilippinesPolandPortugalQatarRomaniaRussian FederationRwandaSamoaSan MarinoSao Tome and PrincipeSenegalSerbiaSierra LeoneSingaporeSlovak RepublicSolomon IslandsSouth AfricaSpainSri LankaSurinameSwazilandSwedenSwitzerlandSyrian Arab RepublicThailandTimor-LesteTrinidad and TobagoTurkeyUgandaUkraineUnited Arab EmiratesUnited KingdomUnited StatesUruguayVanuatuVietnamWest Bank and GazaYemen, Rep.Zimbabwe Timeline:
This timeline shows a graph from 2000 to 2015 of Uganda. No data until 1999. Number of actual observations by date: 15.
Source name:
World Development Indicators
Source organization:
International Monetary Fund, Government Finance Statistics Yearbook and data files.
Categories, topics:
Public Sector
Last updated:
apr 23, 2017
Indicators value changes by year
Minimum:
-2.772 trl
jan 1, 2015
Maximum:
-96.759 bln
jan 1, 2000
At the date of observation
Value
Absolute change
Change from previous value
jan 1, 2000
-96.759 bln
-96.759 bln
0.0%
jan 1, 2001
-175.372 bln
-78.613 bln
81.25%
jan 1, 2002
-97.666 bln
+77.706 bln
-44.31%
jan 1, 2003
-380.84 bln
-283.174 bln
289.94%
jan 1, 2004
-443.897 bln
-63.058 bln
16.56%
jan 1, 2005
-197.805 bln
+246.092 bln
-55.44%
jan 1, 2006
-123.674 bln
+74.131 bln
-37.48%
jan 1, 2007
-279.073 bln
-155.4 bln
125.65%
jan 1, 2008
-500.985 bln
-221.911 bln
79.52%
jan 1, 2009
-332.651 bln
+168.333 bln
-33.6%
jan 1, 2010
-277.55 bln
+55.102 bln
-16.56%
jan 1, 2011
-1.373 trl
-1.095 trl
394.56%
jan 1, 2012
-1.517 trl
-144.129 bln
10.5%
jan 1, 2013
-1.26 trl
+256.398 bln
-16.9%
jan 1, 2015
-2.772 trl
-1.512 trl
119.97%
Ranking of countries by current statistics by years


Comments: