29
/
en
AIzaSyAYiBZKx7MnpbEhh9jyipgxe19OcubqV5w
April 1, 2024
98980
Cambodia
KHM
true
2
1
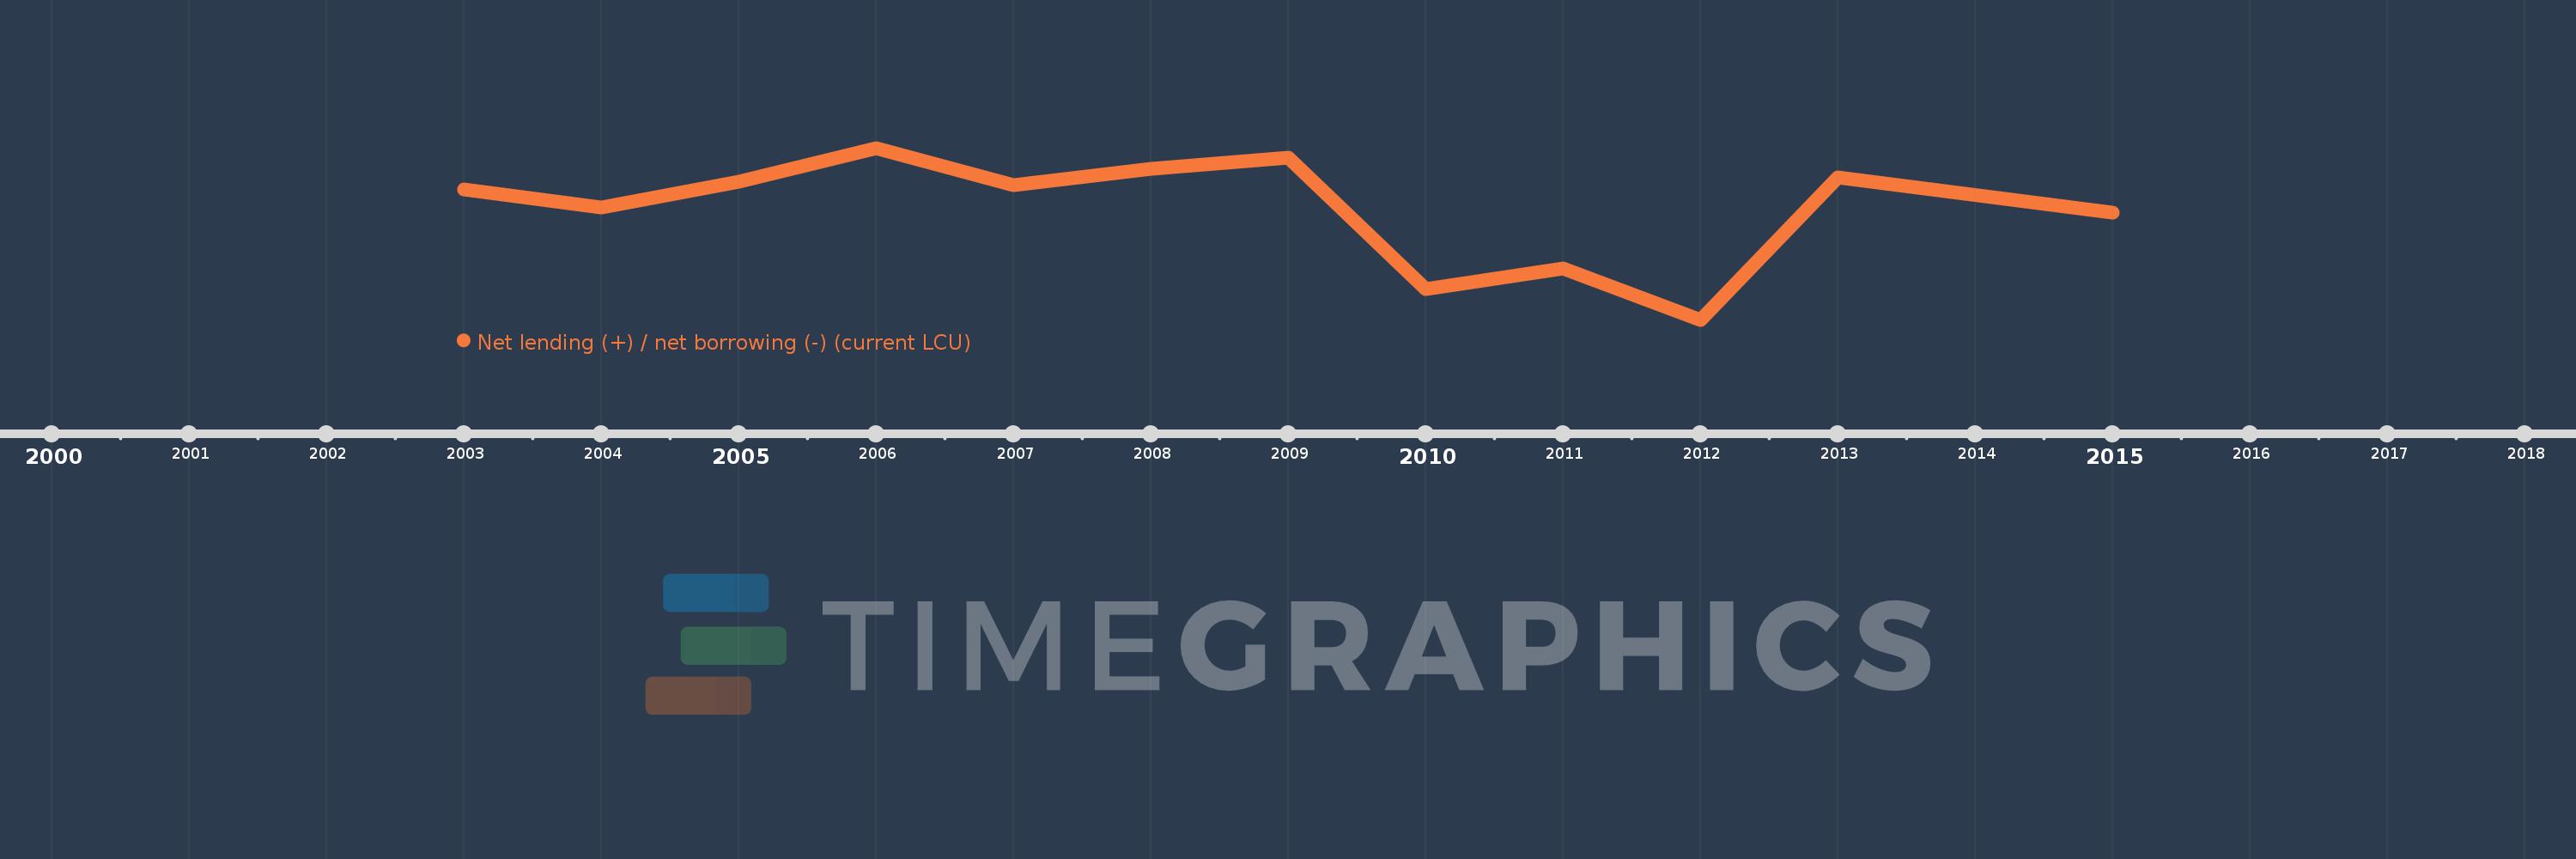
Net lending (+) / net borrowing (-) (current LCU)
2015,2013,2012,2011,2010,2009,2008,2007,2006,2005,2004,2003
This statistics in other country:
AfghanistanAlbaniaAlgeriaAngolaAntigua and BarbudaArmeniaAustraliaAustriaAzerbaijanBahamas, TheBahrainBangladeshBarbadosBelarusBelgiumBelizeBhutanBoliviaBosnia and HerzegovinaBrazilBurundiCabo VerdeCambodiaCanadaCentral African RepublicChileCongo, Dem. Rep.Congo, Rep.Costa RicaCote d'IvoireCroatiaCyprusCzech RepublicDenmarkDominicaDominican RepublicEgypt, Arab Rep.El SalvadorEquatorial GuineaEstoniaEthiopiaFijiFinlandFranceGambia, TheGeorgiaGermanyGreeceGuatemalaHondurasHungaryIcelandIndiaIndonesiaIran, Islamic Rep.IraqIrelandIsraelItalyJamaicaKazakhstanKiribatiKorea, Rep.Kyrgyz RepublicLao PDRLatviaLebanonLithuaniaLuxembourgMacao SAR, ChinaMacedonia, FYRMadagascarMalawiMaldivesMaliMaltaMauritiusMexicoMicronesia, Fed. Sts.MoldovaMongoliaMoroccoMozambiqueNamibiaNepalNetherlandsNew ZealandNicaraguaNigeriaNorwayOmanPakistanParaguayPeruPhilippinesPolandPortugalQatarRomaniaRussian FederationRwandaSamoaSan MarinoSao Tome and PrincipeSenegalSerbiaSierra LeoneSingaporeSlovak RepublicSolomon IslandsSouth AfricaSpainSri LankaSurinameSwazilandSwedenSwitzerlandSyrian Arab RepublicThailandTimor-LesteTrinidad and TobagoTurkeyUgandaUkraineUnited Arab EmiratesUnited KingdomUnited StatesUruguayVanuatuVietnamWest Bank and GazaYemen, Rep.Zimbabwe Timeline:
This timeline shows a graph from 2003 to 2015 of Cambodia. No data until 2002. Number of actual observations by date: 12.
Source name:
World Development Indicators
Source organization:
International Monetary Fund, Government Finance Statistics Yearbook and data files.
Categories, topics:
Public Sector
Last updated:
apr 23, 2017
Indicators value changes by year
Minimum:
-2.376 trl
jan 1, 2012
Maximum:
10.393 bln
jan 1, 2006
At the date of observation
Value
Absolute change
Change from previous value
jan 1, 2003
-568.002 bln
-568.002 bln
0.0%
jan 1, 2004
-819.18 bln
-251.177 bln
44.22%
jan 1, 2005
-462.509 bln
+356.671 bln
-43.54%
jan 1, 2006
10.393 bln
+472.902 bln
-102.25%
jan 1, 2007
-511.413 bln
-521.806 bln
-5.02K%
jan 1, 2008
-281.921 bln
+229.492 bln
-44.87%
jan 1, 2009
-129.285 bln
+152.636 bln
-54.14%
jan 1, 2010
-1.954 trl
-1.824 trl
1.41K%
jan 1, 2011
-1.66 trl
+294.25 bln
-15.06%
jan 1, 2012
-2.376 trl
-716.888 bln
43.2%
jan 1, 2013
-404.157 bln
+1.972 trl
-82.99%
jan 1, 2015
-893.645 bln
-489.488 bln
121.11%
Ranking of countries by current statistics by years


Comments: