29
/
en
AIzaSyAYiBZKx7MnpbEhh9jyipgxe19OcubqV5w
April 1, 2024
79769
Barbados
BRB
true
2
1
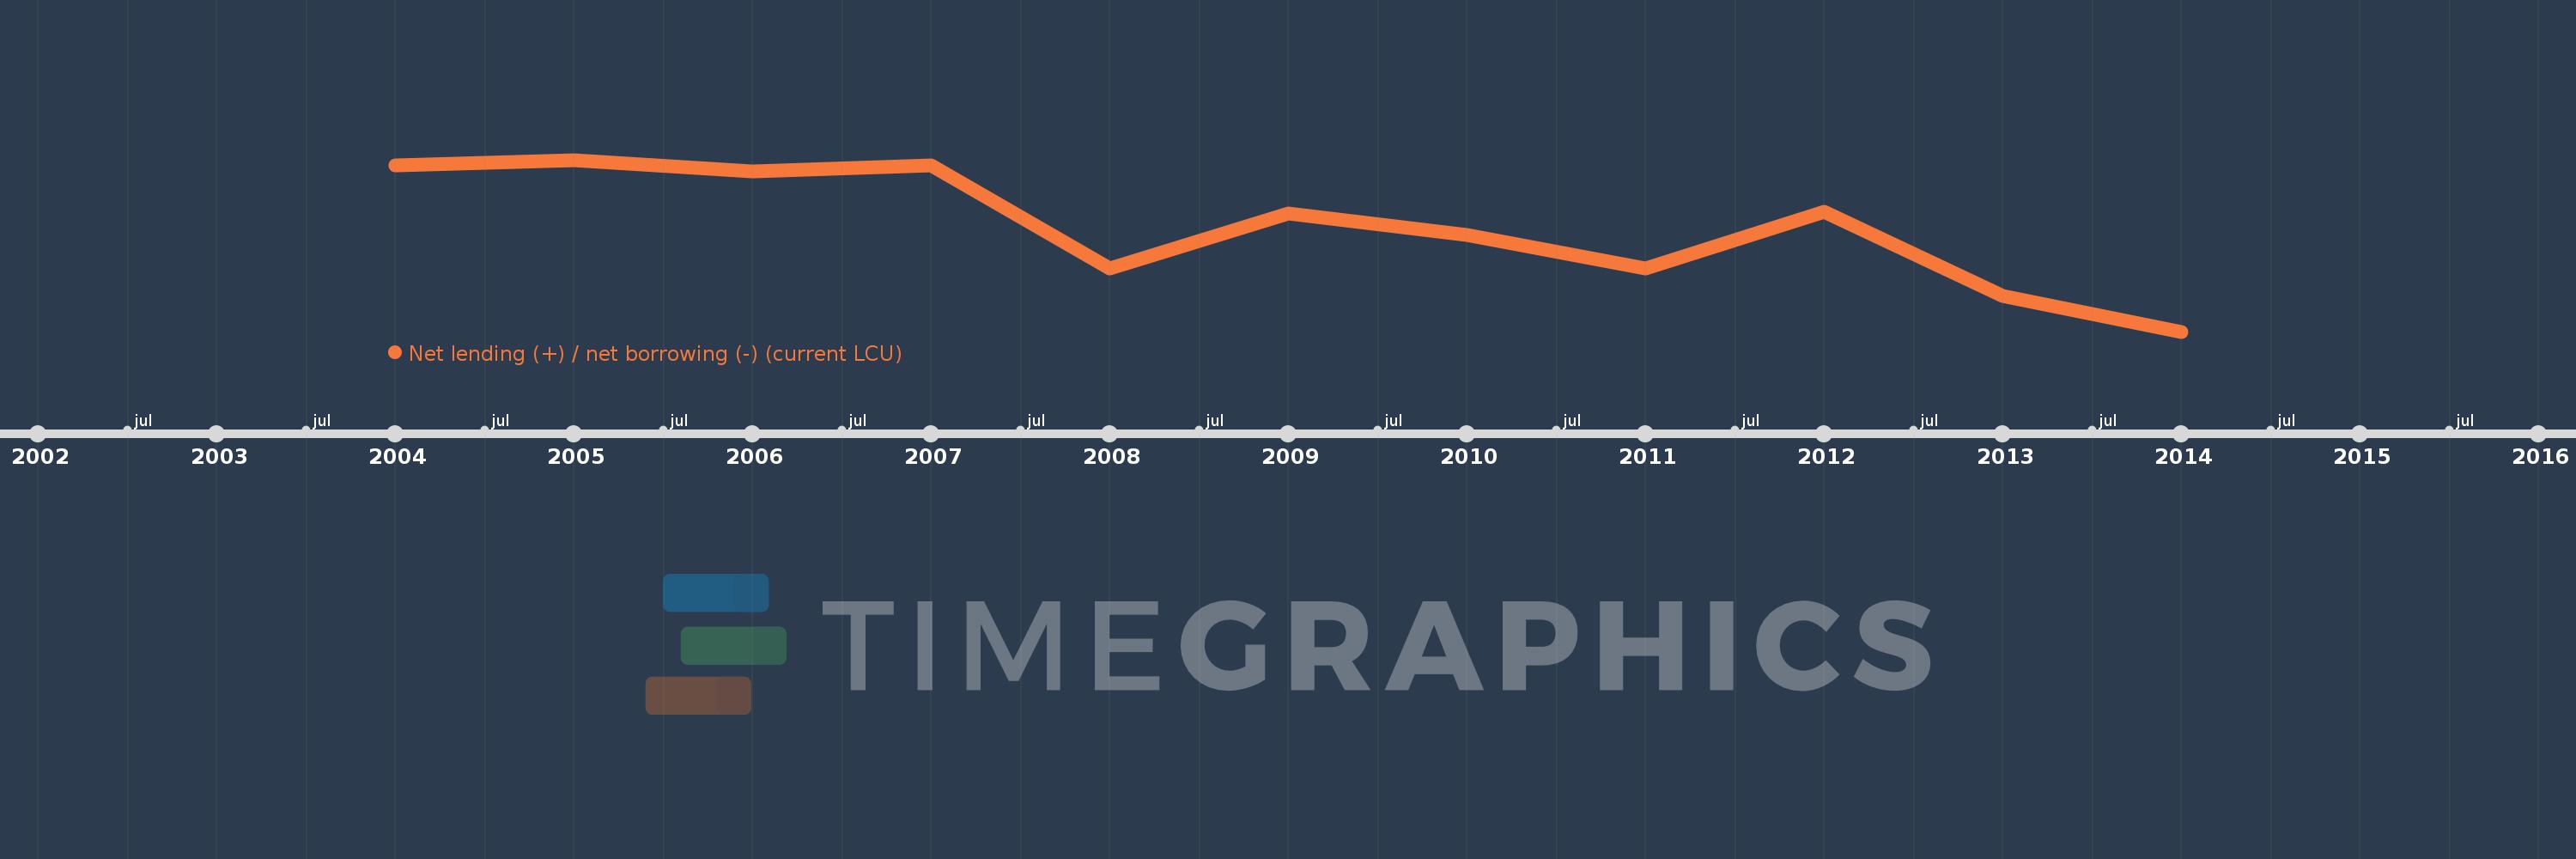
Net lending (+) / net borrowing (-) (current LCU)
2014,2013,2012,2011,2010,2009,2008,2007,2006,2005,2004
This statistics in other country:
AfghanistanAlbaniaAlgeriaAngolaAntigua and BarbudaArmeniaAustraliaAustriaAzerbaijanBahamas, TheBahrainBangladeshBarbadosBelarusBelgiumBelizeBhutanBoliviaBosnia and HerzegovinaBrazilBurundiCabo VerdeCambodiaCanadaCentral African RepublicChileCongo, Dem. Rep.Congo, Rep.Costa RicaCote d'IvoireCroatiaCyprusCzech RepublicDenmarkDominicaDominican RepublicEgypt, Arab Rep.El SalvadorEquatorial GuineaEstoniaEthiopiaFijiFinlandFranceGambia, TheGeorgiaGermanyGreeceGuatemalaHondurasHungaryIcelandIndiaIndonesiaIran, Islamic Rep.IraqIrelandIsraelItalyJamaicaKazakhstanKiribatiKorea, Rep.Kyrgyz RepublicLao PDRLatviaLebanonLithuaniaLuxembourgMacao SAR, ChinaMacedonia, FYRMadagascarMalawiMaldivesMaliMaltaMauritiusMexicoMicronesia, Fed. Sts.MoldovaMongoliaMoroccoMozambiqueNamibiaNepalNetherlandsNew ZealandNicaraguaNigeriaNorwayOmanPakistanParaguayPeruPhilippinesPolandPortugalQatarRomaniaRussian FederationRwandaSamoaSan MarinoSao Tome and PrincipeSenegalSerbiaSierra LeoneSingaporeSlovak RepublicSolomon IslandsSouth AfricaSpainSri LankaSurinameSwazilandSwedenSwitzerlandSyrian Arab RepublicThailandTimor-LesteTrinidad and TobagoTurkeyUgandaUkraineUnited Arab EmiratesUnited KingdomUnited StatesUruguayVanuatuVietnamWest Bank and GazaYemen, Rep.Zimbabwe Timeline:
This timeline shows a graph from 2004 to 2014 of Barbados. No data until 2003. Number of actual observations by date: 11.
Source name:
World Development Indicators
Source organization:
International Monetary Fund, Government Finance Statistics Yearbook and data files.
Categories, topics:
Public Sector
Last updated:
apr 23, 2017
Indicators value changes by year
Minimum:
-1.048 bln
jan 1, 2014
Maximum:
-121.8 mln
jan 1, 2005
At the date of observation
Value
Absolute change
Change from previous value
jan 1, 2004
-154.131 mln
-154.131 mln
0.0%
jan 1, 2005
-121.8 mln
+32.331 mln
-20.98%
jan 1, 2006
-182.81 mln
-61.01 mln
50.09%
jan 1, 2007
-149.723 mln
+33.087 mln
-18.1%
jan 1, 2008
-709.366 mln
-559.643 mln
373.78%
jan 1, 2009
-411.796 mln
+297.57 mln
-41.95%
jan 1, 2010
-526.434 mln
-114.638 mln
27.84%
jan 1, 2011
-707.701 mln
-181.267 mln
34.43%
jan 1, 2012
-399.842 mln
+307.859 mln
-43.5%
jan 1, 2013
-854.855 mln
-455.013 mln
113.8%
jan 1, 2014
-1.048 bln
-193.264 mln
22.61%
Ranking of countries by current statistics by years


Comments: