29
/
en
AIzaSyAYiBZKx7MnpbEhh9jyipgxe19OcubqV5w
April 1, 2024
175667
Latvia
LVA
true
2
1
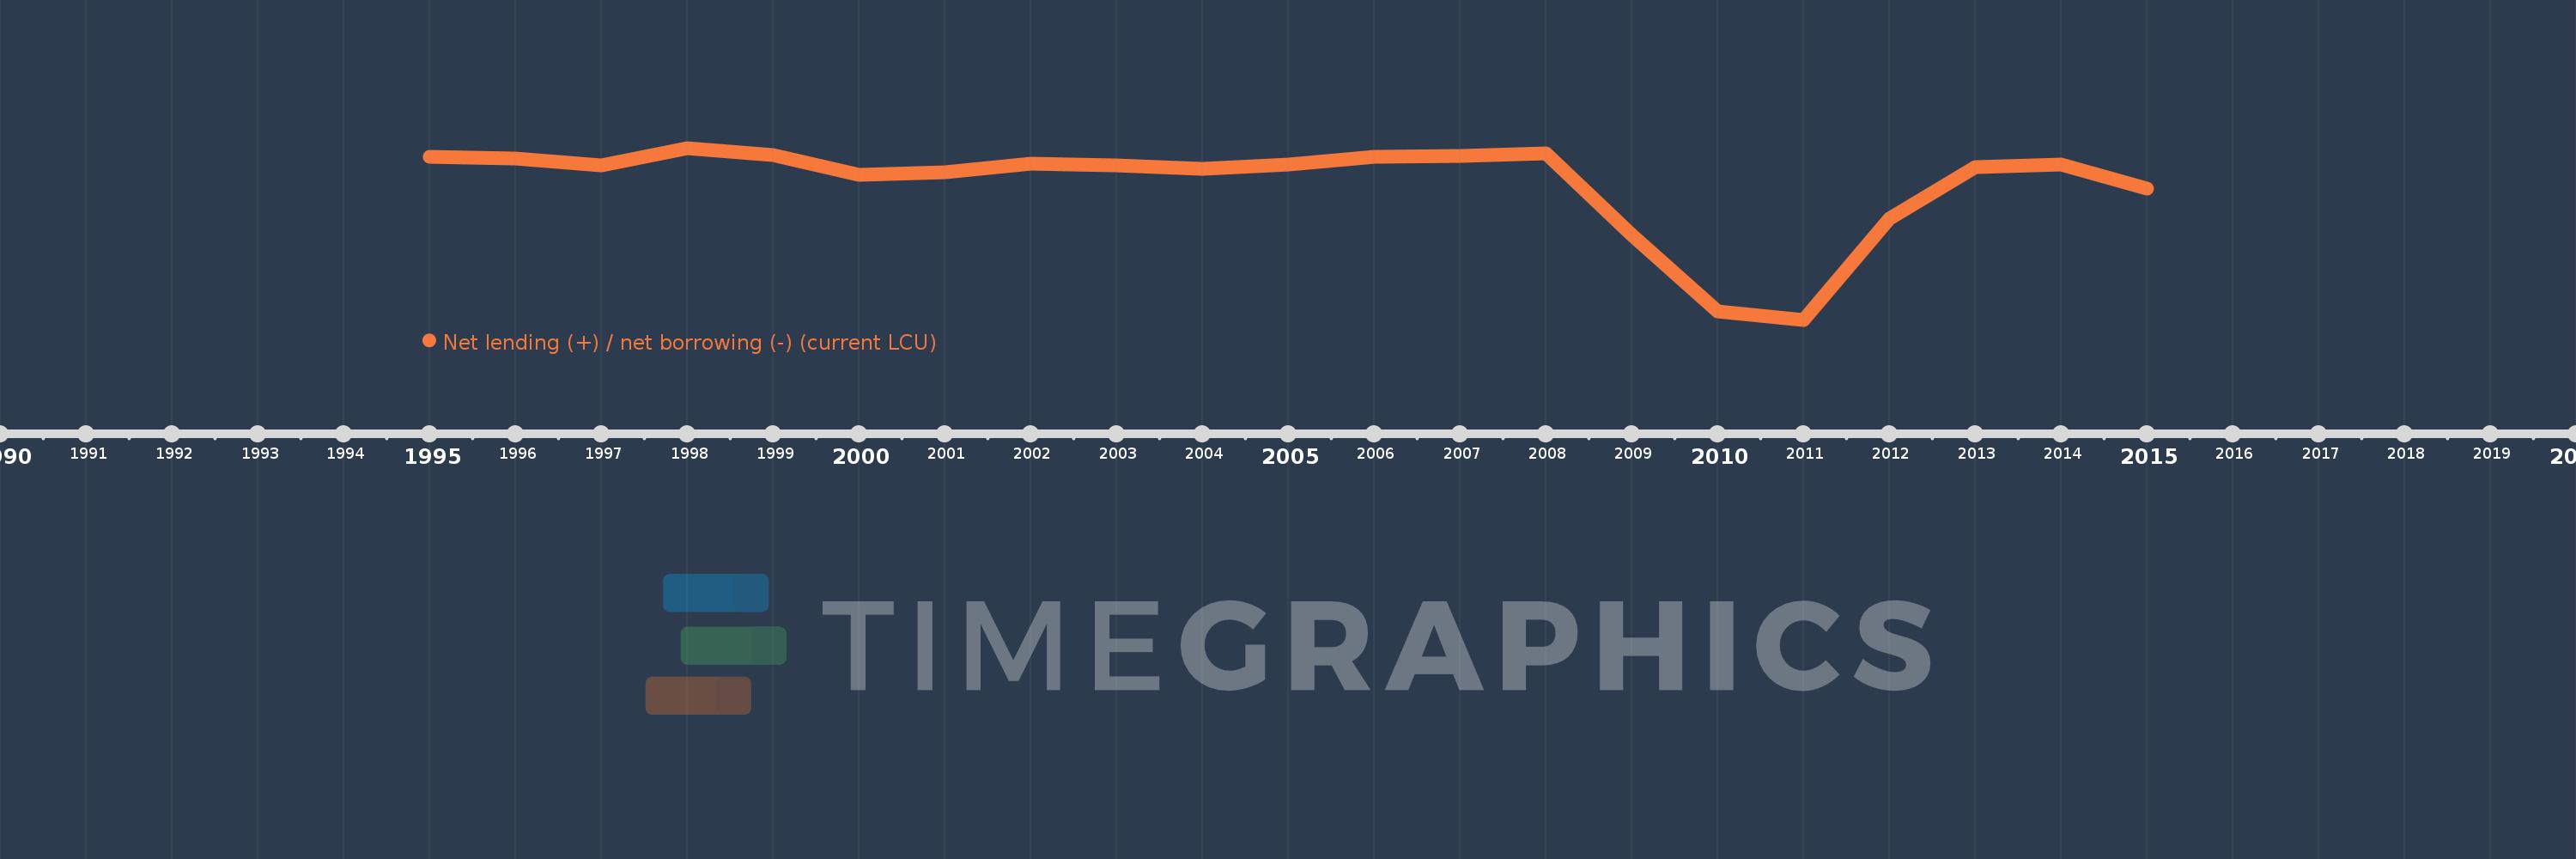
Net lending (+) / net borrowing (-) (current LCU)
2015,2014,2013,2012,2011,2010,2009,2008,2007,2006,2005,2004,2003,2002,2001,2000,1999,1998,1997,1996,1995
This statistics in other country:
AfghanistanAlbaniaAlgeriaAngolaAntigua and BarbudaArmeniaAustraliaAustriaAzerbaijanBahamas, TheBahrainBangladeshBarbadosBelarusBelgiumBelizeBhutanBoliviaBosnia and HerzegovinaBrazilBurundiCabo VerdeCambodiaCanadaCentral African RepublicChileCongo, Dem. Rep.Congo, Rep.Costa RicaCote d'IvoireCroatiaCyprusCzech RepublicDenmarkDominicaDominican RepublicEgypt, Arab Rep.El SalvadorEquatorial GuineaEstoniaEthiopiaFijiFinlandFranceGambia, TheGeorgiaGermanyGreeceGuatemalaHondurasHungaryIcelandIndiaIndonesiaIran, Islamic Rep.IraqIrelandIsraelItalyJamaicaKazakhstanKiribatiKorea, Rep.Kyrgyz RepublicLao PDRLatviaLebanonLithuaniaLuxembourgMacao SAR, ChinaMacedonia, FYRMadagascarMalawiMaldivesMaliMaltaMauritiusMexicoMicronesia, Fed. Sts.MoldovaMongoliaMoroccoMozambiqueNamibiaNepalNetherlandsNew ZealandNicaraguaNigeriaNorwayOmanPakistanParaguayPeruPhilippinesPolandPortugalQatarRomaniaRussian FederationRwandaSamoaSan MarinoSao Tome and PrincipeSenegalSerbiaSierra LeoneSingaporeSlovak RepublicSolomon IslandsSouth AfricaSpainSri LankaSurinameSwazilandSwedenSwitzerlandSyrian Arab RepublicThailandTimor-LesteTrinidad and TobagoTurkeyUgandaUkraineUnited Arab EmiratesUnited KingdomUnited StatesUruguayVanuatuVietnamWest Bank and GazaYemen, Rep.Zimbabwe Timeline:
This timeline shows a graph from 1995 to 2015 of Latvia. No data until 1994. Number of actual observations by date: 21.
Source name:
World Development Indicators
Source organization:
International Monetary Fund, Government Finance Statistics Yearbook and data files.
Categories, topics:
Public Sector
Last updated:
apr 23, 2017
Indicators value changes by year
Minimum:
-2.075 bln
jan 1, 2011
Maximum:
57.783 mln
jan 1, 1998
At the date of observation
Value
Absolute change
Change from previous value
jan 1, 1995
-53.913 mln
-53.913 mln
0.0%
jan 1, 1996
-76.977 mln
-23.065 mln
42.78%
jan 1, 1997
-163.986 mln
-87.009 mln
113.03%
jan 1, 1998
57.783 mln
+221.769 mln
-135.24%
jan 1, 1999
-29.795 mln
-87.578 mln
-151.56%
jan 1, 2000
-281.145 mln
-251.35 mln
843.6%
jan 1, 2001
-241.589 mln
+39.556 mln
-14.07%
jan 1, 2002
-132.526 mln
+109.063 mln
-45.14%
jan 1, 2003
-161.652 mln
-29.126 mln
21.98%
jan 1, 2004
-203.841 mln
-42.188 mln
26.1%
jan 1, 2005
-145.304 mln
+58.537 mln
-28.72%
jan 1, 2006
-56.616 mln
+88.688 mln
-61.04%
jan 1, 2007
-39.826 mln
+16.79 mln
-29.66%
jan 1, 2008
-4.952 mln
+34.875 mln
-87.57%
jan 1, 2009
-1.023 bln
-1.019 bln
20.57K%
jan 1, 2010
-1.968 bln
-944.986 mln
92.33%
jan 1, 2011
-2.075 bln
-106.858 mln
5.43%
jan 1, 2012
-823.601 mln
+1.252 bln
-60.31%
jan 1, 2013
-180.762 mln
+642.839 mln
-78.05%
jan 1, 2014
-146.869 mln
+33.893 mln
-18.75%
jan 1, 2015
-448.304 mln
-301.435 mln
205.24%
Ranking of countries by current statistics by years


Comments: