29
/
en
AIzaSyAYiBZKx7MnpbEhh9jyipgxe19OcubqV5w
April 1, 2024
284998
Yemen, Rep.
YEM
true
2
1
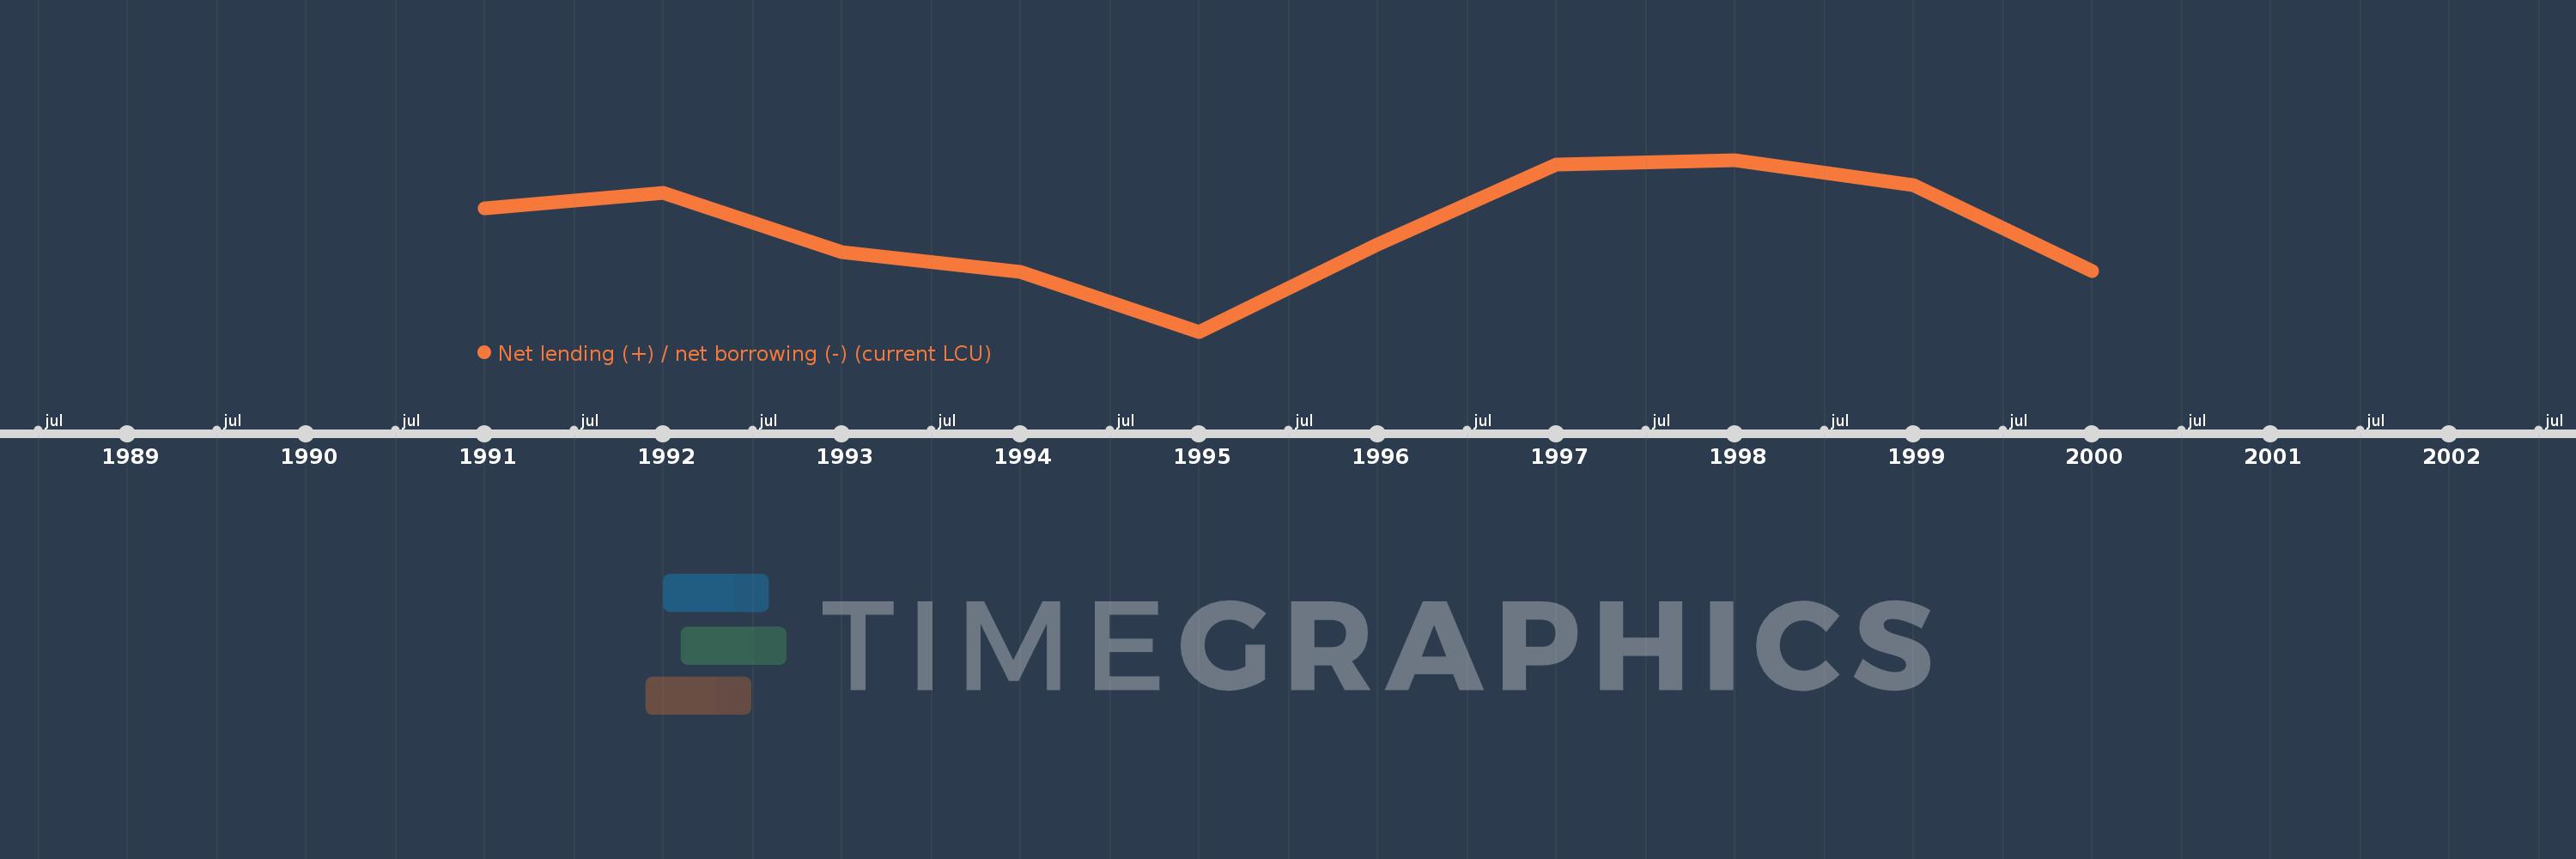
Net lending (+) / net borrowing (-) (current LCU)
2000,1999,1998,1997,1996,1995,1994,1993,1992,1991
This statistics in other country:
AfghanistanAlbaniaAlgeriaAngolaAntigua and BarbudaArmeniaAustraliaAustriaAzerbaijanBahamas, TheBahrainBangladeshBarbadosBelarusBelgiumBelizeBhutanBoliviaBosnia and HerzegovinaBrazilBurundiCabo VerdeCambodiaCanadaCentral African RepublicChileCongo, Dem. Rep.Congo, Rep.Costa RicaCote d'IvoireCroatiaCyprusCzech RepublicDenmarkDominicaDominican RepublicEgypt, Arab Rep.El SalvadorEquatorial GuineaEstoniaEthiopiaFijiFinlandFranceGambia, TheGeorgiaGermanyGreeceGuatemalaHondurasHungaryIcelandIndiaIndonesiaIran, Islamic Rep.IraqIrelandIsraelItalyJamaicaKazakhstanKiribatiKorea, Rep.Kyrgyz RepublicLao PDRLatviaLebanonLithuaniaLuxembourgMacao SAR, ChinaMacedonia, FYRMadagascarMalawiMaldivesMaliMaltaMauritiusMexicoMicronesia, Fed. Sts.MoldovaMongoliaMoroccoMozambiqueNamibiaNepalNetherlandsNew ZealandNicaraguaNigeriaNorwayOmanPakistanParaguayPeruPhilippinesPolandPortugalQatarRomaniaRussian FederationRwandaSamoaSan MarinoSao Tome and PrincipeSenegalSerbiaSierra LeoneSingaporeSlovak RepublicSolomon IslandsSouth AfricaSpainSri LankaSurinameSwazilandSwedenSwitzerlandSyrian Arab RepublicThailandTimor-LesteTrinidad and TobagoTurkeyUgandaUkraineUnited Arab EmiratesUnited KingdomUnited StatesUruguayVanuatuVietnamWest Bank and GazaYemen, Rep.Zimbabwe Timeline:
This timeline shows a graph from 1991 to 2000 of Yemen, Rep.. No data until 1990. Number of actual observations by date: 10.
Source name:
World Development Indicators
Source organization:
International Monetary Fund, Government Finance Statistics Yearbook and data files.
Categories, topics:
Public Sector
Last updated:
apr 23, 2017
Indicators value changes by year
Minimum:
-43.635 bln
jan 1, 1995
Maximum:
3.375 bln
jan 1, 1998
At the date of observation
Value
Absolute change
Change from previous value
jan 1, 1991
-9.855 bln
-9.855 bln
0.0%
jan 1, 1992
-5.785 bln
+4.07 bln
-41.3%
jan 1, 1993
-21.937 bln
-16.152 bln
279.2%
jan 1, 1994
-27.326 bln
-5.389 bln
24.57%
jan 1, 1995
-43.635 bln
-16.309 bln
59.68%
jan 1, 1996
-19.862 bln
+23.773 bln
-54.48%
jan 1, 1997
2.185 bln
+22.047 bln
-111.0%
jan 1, 1998
3.375 bln
+1.19 bln
54.46%
jan 1, 1999
-3.671 bln
-7.046 bln
-208.77%
jan 1, 2000
-27.065 bln
-23.394 bln
637.27%
Ranking of countries by current statistics by years


Comments: