29
/
en
AIzaSyAYiBZKx7MnpbEhh9jyipgxe19OcubqV5w
April 1, 2024
205610
Namibia
NAM
true
2
1
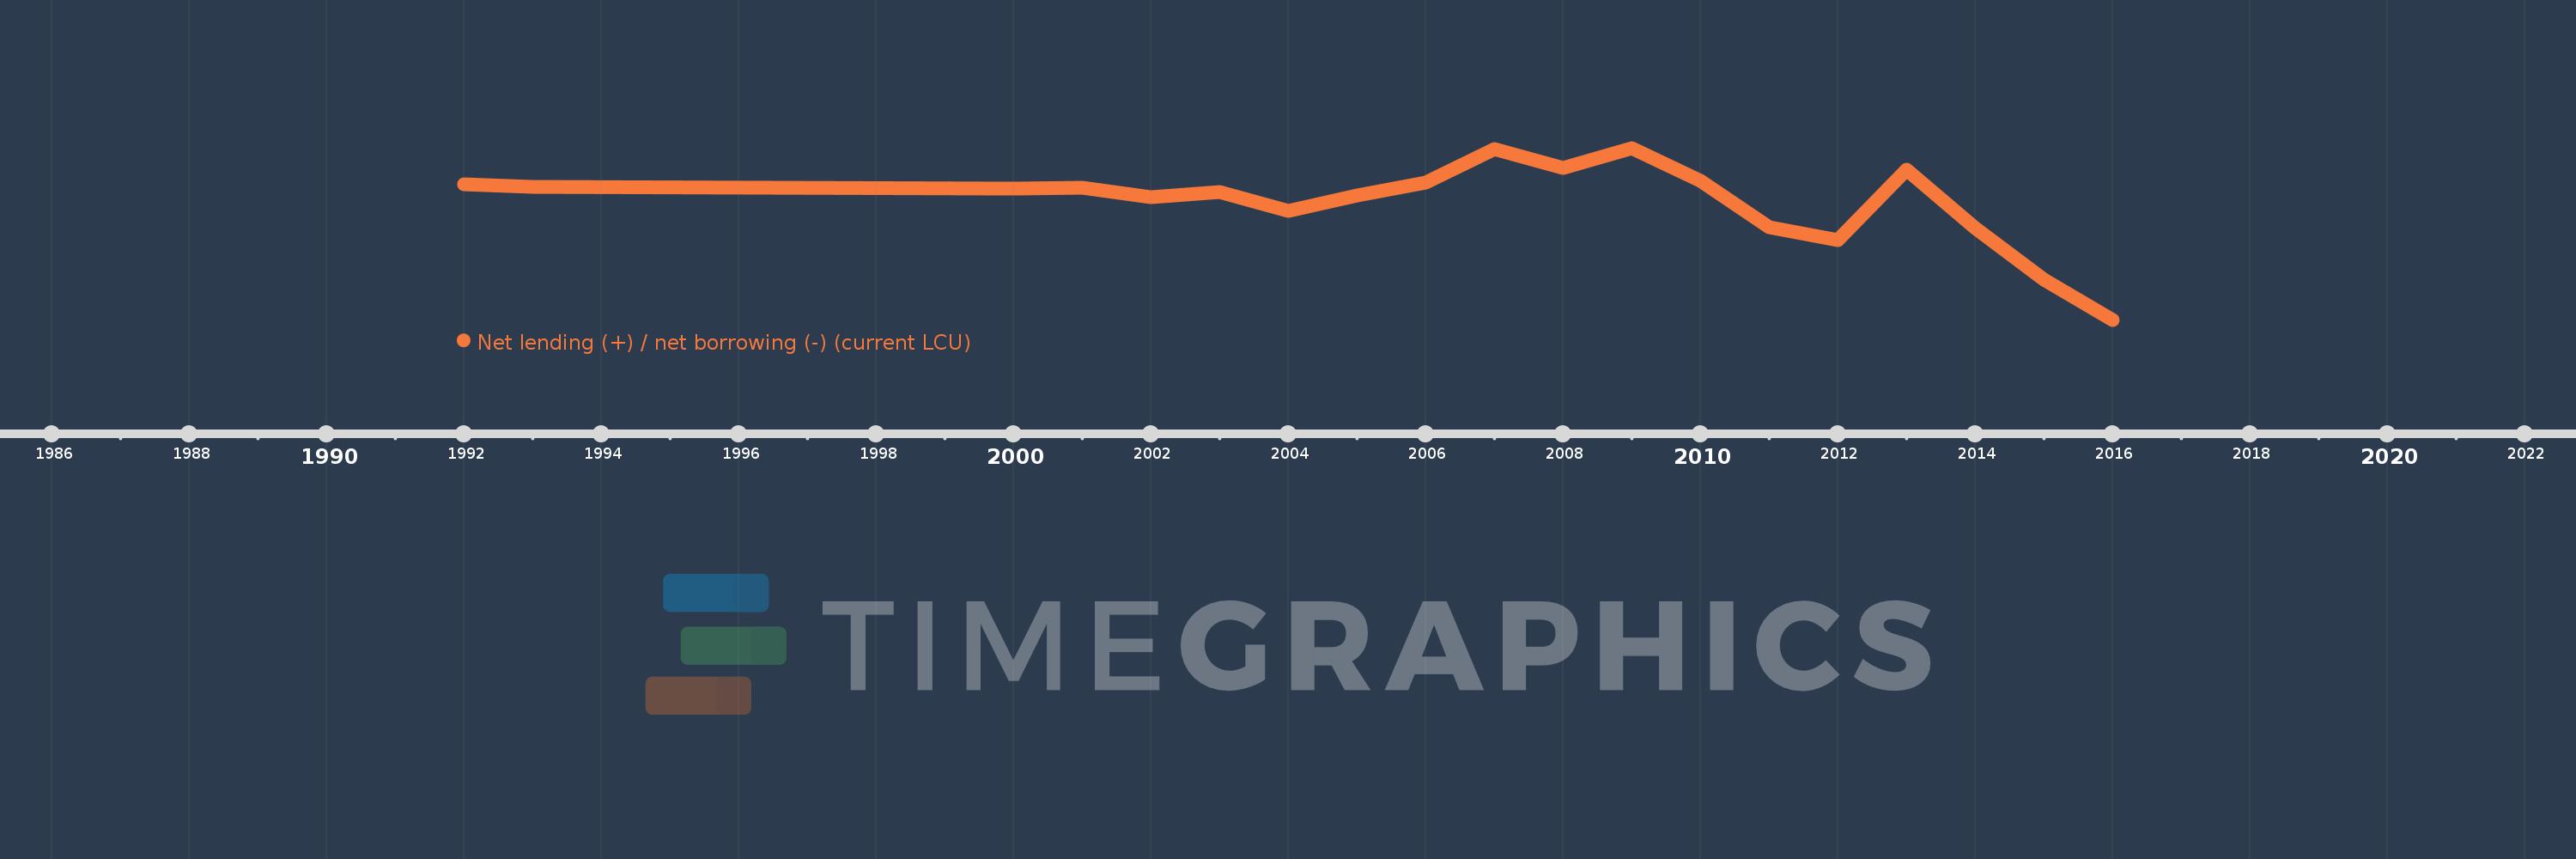
Net lending (+) / net borrowing (-) (current LCU)
2016,2015,2014,2013,2012,2011,2010,2009,2008,2007,2006,2005,2004,2003,2002,2001,2000,1993,1992
This statistics in other country:
AfghanistanAlbaniaAlgeriaAngolaAntigua and BarbudaArmeniaAustraliaAustriaAzerbaijanBahamas, TheBahrainBangladeshBarbadosBelarusBelgiumBelizeBhutanBoliviaBosnia and HerzegovinaBrazilBurundiCabo VerdeCambodiaCanadaCentral African RepublicChileCongo, Dem. Rep.Congo, Rep.Costa RicaCote d'IvoireCroatiaCyprusCzech RepublicDenmarkDominicaDominican RepublicEgypt, Arab Rep.El SalvadorEquatorial GuineaEstoniaEthiopiaFijiFinlandFranceGambia, TheGeorgiaGermanyGreeceGuatemalaHondurasHungaryIcelandIndiaIndonesiaIran, Islamic Rep.IraqIrelandIsraelItalyJamaicaKazakhstanKiribatiKorea, Rep.Kyrgyz RepublicLao PDRLatviaLebanonLithuaniaLuxembourgMacao SAR, ChinaMacedonia, FYRMadagascarMalawiMaldivesMaliMaltaMauritiusMexicoMicronesia, Fed. Sts.MoldovaMongoliaMoroccoMozambiqueNamibiaNepalNetherlandsNew ZealandNicaraguaNigeriaNorwayOmanPakistanParaguayPeruPhilippinesPolandPortugalQatarRomaniaRussian FederationRwandaSamoaSan MarinoSao Tome and PrincipeSenegalSerbiaSierra LeoneSingaporeSlovak RepublicSolomon IslandsSouth AfricaSpainSri LankaSurinameSwazilandSwedenSwitzerlandSyrian Arab RepublicThailandTimor-LesteTrinidad and TobagoTurkeyUgandaUkraineUnited Arab EmiratesUnited KingdomUnited StatesUruguayVanuatuVietnamWest Bank and GazaYemen, Rep.Zimbabwe Timeline:
This timeline shows a graph from 1992 to 2016 of Namibia. No data until 1991. Number of actual observations by date: 19.
Source name:
World Development Indicators
Source organization:
International Monetary Fund, Government Finance Statistics Yearbook and data files.
Categories, topics:
Public Sector
Last updated:
apr 23, 2017
Indicators value changes by year
Minimum:
-11.763 bln
jan 1, 2016
Maximum:
2.923 bln
jan 1, 2009
At the date of observation
Value
Absolute change
Change from previous value
jan 1, 1992
-176.4 mln
-176.4 mln
0.0%
jan 1, 1993
-404.7 mln
-228.3 mln
129.42%
jan 1, 2000
-578.0 mln
-173.3 mln
42.82%
jan 1, 2001
-442.072 mln
+135.928 mln
-23.52%
jan 1, 2002
-1.278 bln
-835.853 mln
189.08%
jan 1, 2003
-846.276 mln
+431.649 mln
-33.78%
jan 1, 2004
-2.487 bln
-1.641 bln
193.91%
jan 1, 2005
-1.102 bln
+1.386 bln
-55.71%
jan 1, 2006
-22.451 mln
+1.079 bln
-97.96%
jan 1, 2007
2.794 bln
+2.817 bln
-12.55K%
jan 1, 2008
1.217 bln
-1.577 bln
-56.45%
jan 1, 2009
2.923 bln
+1.706 bln
140.22%
jan 1, 2010
84.029 mln
-2.839 bln
-97.13%
jan 1, 2011
-3.845 bln
-3.93 bln
-4.68K%
jan 1, 2012
-4.924 bln
-1.079 bln
28.06%
jan 1, 2013
1.087 bln
+6.012 bln
-122.08%
jan 1, 2014
-3.947 bln
-5.034 bln
-462.99%
jan 1, 2015
-8.338 bln
-4.392 bln
111.27%
jan 1, 2016
-11.763 bln
-3.425 bln
41.07%
Ranking of countries by current statistics by years


Comments: