29
/
en
AIzaSyAYiBZKx7MnpbEhh9jyipgxe19OcubqV5w
April 1, 2024
88926
Bosnia and Herzegovina
BIH
true
2
1
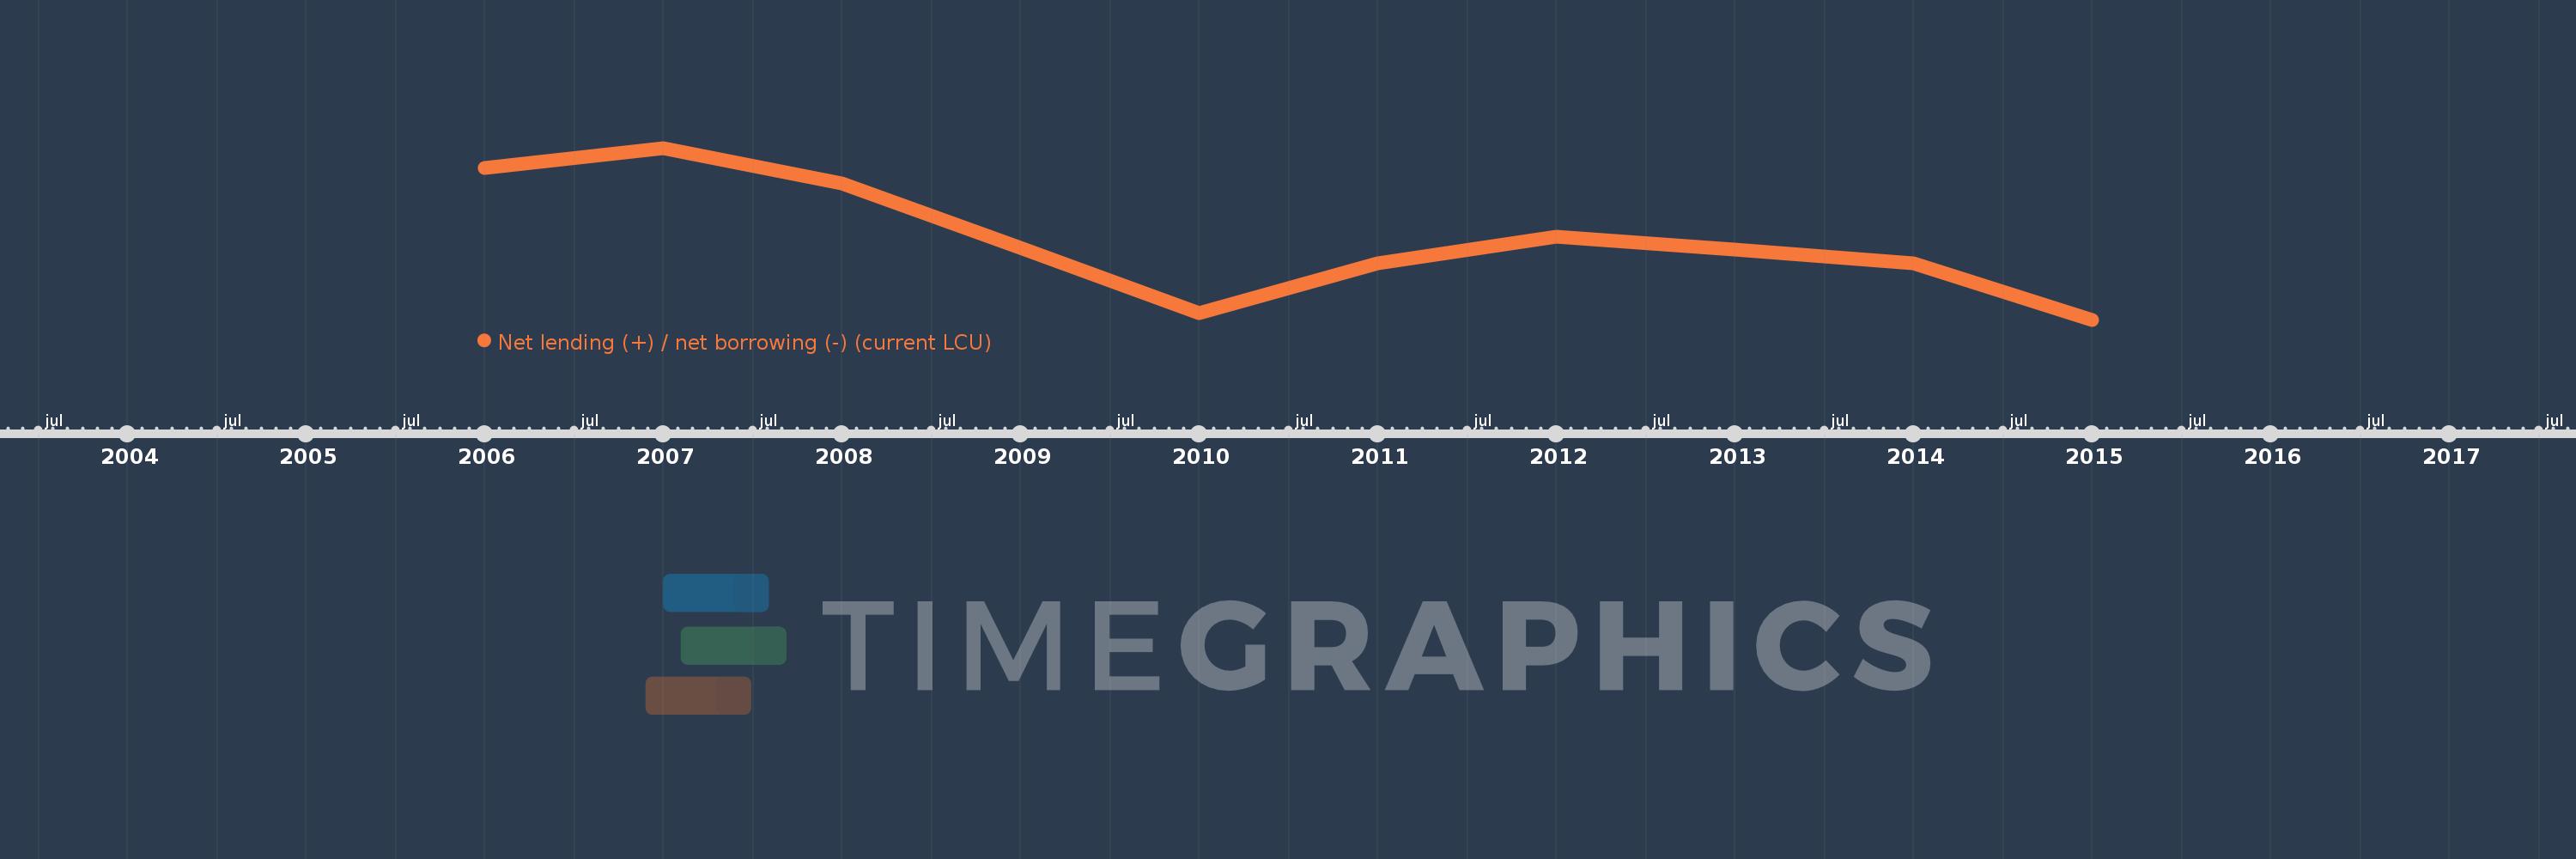
Net lending (+) / net borrowing (-) (current LCU)
2015,2014,2013,2012,2011,2010,2009,2008,2007,2006
This statistics in other country:
AfghanistanAlbaniaAlgeriaAngolaAntigua and BarbudaArmeniaAustraliaAustriaAzerbaijanBahamas, TheBahrainBangladeshBarbadosBelarusBelgiumBelizeBhutanBoliviaBosnia and HerzegovinaBrazilBurundiCabo VerdeCambodiaCanadaCentral African RepublicChileCongo, Dem. Rep.Congo, Rep.Costa RicaCote d'IvoireCroatiaCyprusCzech RepublicDenmarkDominicaDominican RepublicEgypt, Arab Rep.El SalvadorEquatorial GuineaEstoniaEthiopiaFijiFinlandFranceGambia, TheGeorgiaGermanyGreeceGuatemalaHondurasHungaryIcelandIndiaIndonesiaIran, Islamic Rep.IraqIrelandIsraelItalyJamaicaKazakhstanKiribatiKorea, Rep.Kyrgyz RepublicLao PDRLatviaLebanonLithuaniaLuxembourgMacao SAR, ChinaMacedonia, FYRMadagascarMalawiMaldivesMaliMaltaMauritiusMexicoMicronesia, Fed. Sts.MoldovaMongoliaMoroccoMozambiqueNamibiaNepalNetherlandsNew ZealandNicaraguaNigeriaNorwayOmanPakistanParaguayPeruPhilippinesPolandPortugalQatarRomaniaRussian FederationRwandaSamoaSan MarinoSao Tome and PrincipeSenegalSerbiaSierra LeoneSingaporeSlovak RepublicSolomon IslandsSouth AfricaSpainSri LankaSurinameSwazilandSwedenSwitzerlandSyrian Arab RepublicThailandTimor-LesteTrinidad and TobagoTurkeyUgandaUkraineUnited Arab EmiratesUnited KingdomUnited StatesUruguayVanuatuVietnamWest Bank and GazaYemen, Rep.Zimbabwe Timeline:
This timeline shows a graph from 2006 to 2015 of Bosnia and Herzegovina. No data until 2005. Number of actual observations by date: 10.
Source name:
World Development Indicators
Source organization:
International Monetary Fund, Government Finance Statistics Yearbook and data files.
Categories, topics:
Public Sector
Last updated:
apr 23, 2017
Indicators value changes by year
Minimum:
-1.102 bln
jan 1, 2015
Maximum:
550.715 mln
jan 1, 2007
At the date of observation
Value
Absolute change
Change from previous value
jan 1, 2006
354.422 mln
+354.422 mln
0.0%
jan 1, 2007
550.715 mln
+196.293 mln
55.38%
jan 1, 2008
206.664 mln
-344.051 mln
-62.47%
jan 1, 2009
-409.606 mln
-616.269 mln
-298.2%
jan 1, 2010
-1.037 bln
-627.452 mln
153.18%
jan 1, 2011
-555.276 mln
+481.782 mln
-46.46%
jan 1, 2012
-299.979 mln
+255.297 mln
-45.98%
jan 1, 2013
-422.793 mln
-122.815 mln
40.94%
jan 1, 2014
-556.306 mln
-133.513 mln
31.58%
jan 1, 2015
-1.102 bln
-545.774 mln
98.11%
Ranking of countries by current statistics by years


Comments: