29
/
en
AIzaSyAYiBZKx7MnpbEhh9jyipgxe19OcubqV5w
April 1, 2024
65111
Albania
ALB
true
2
1
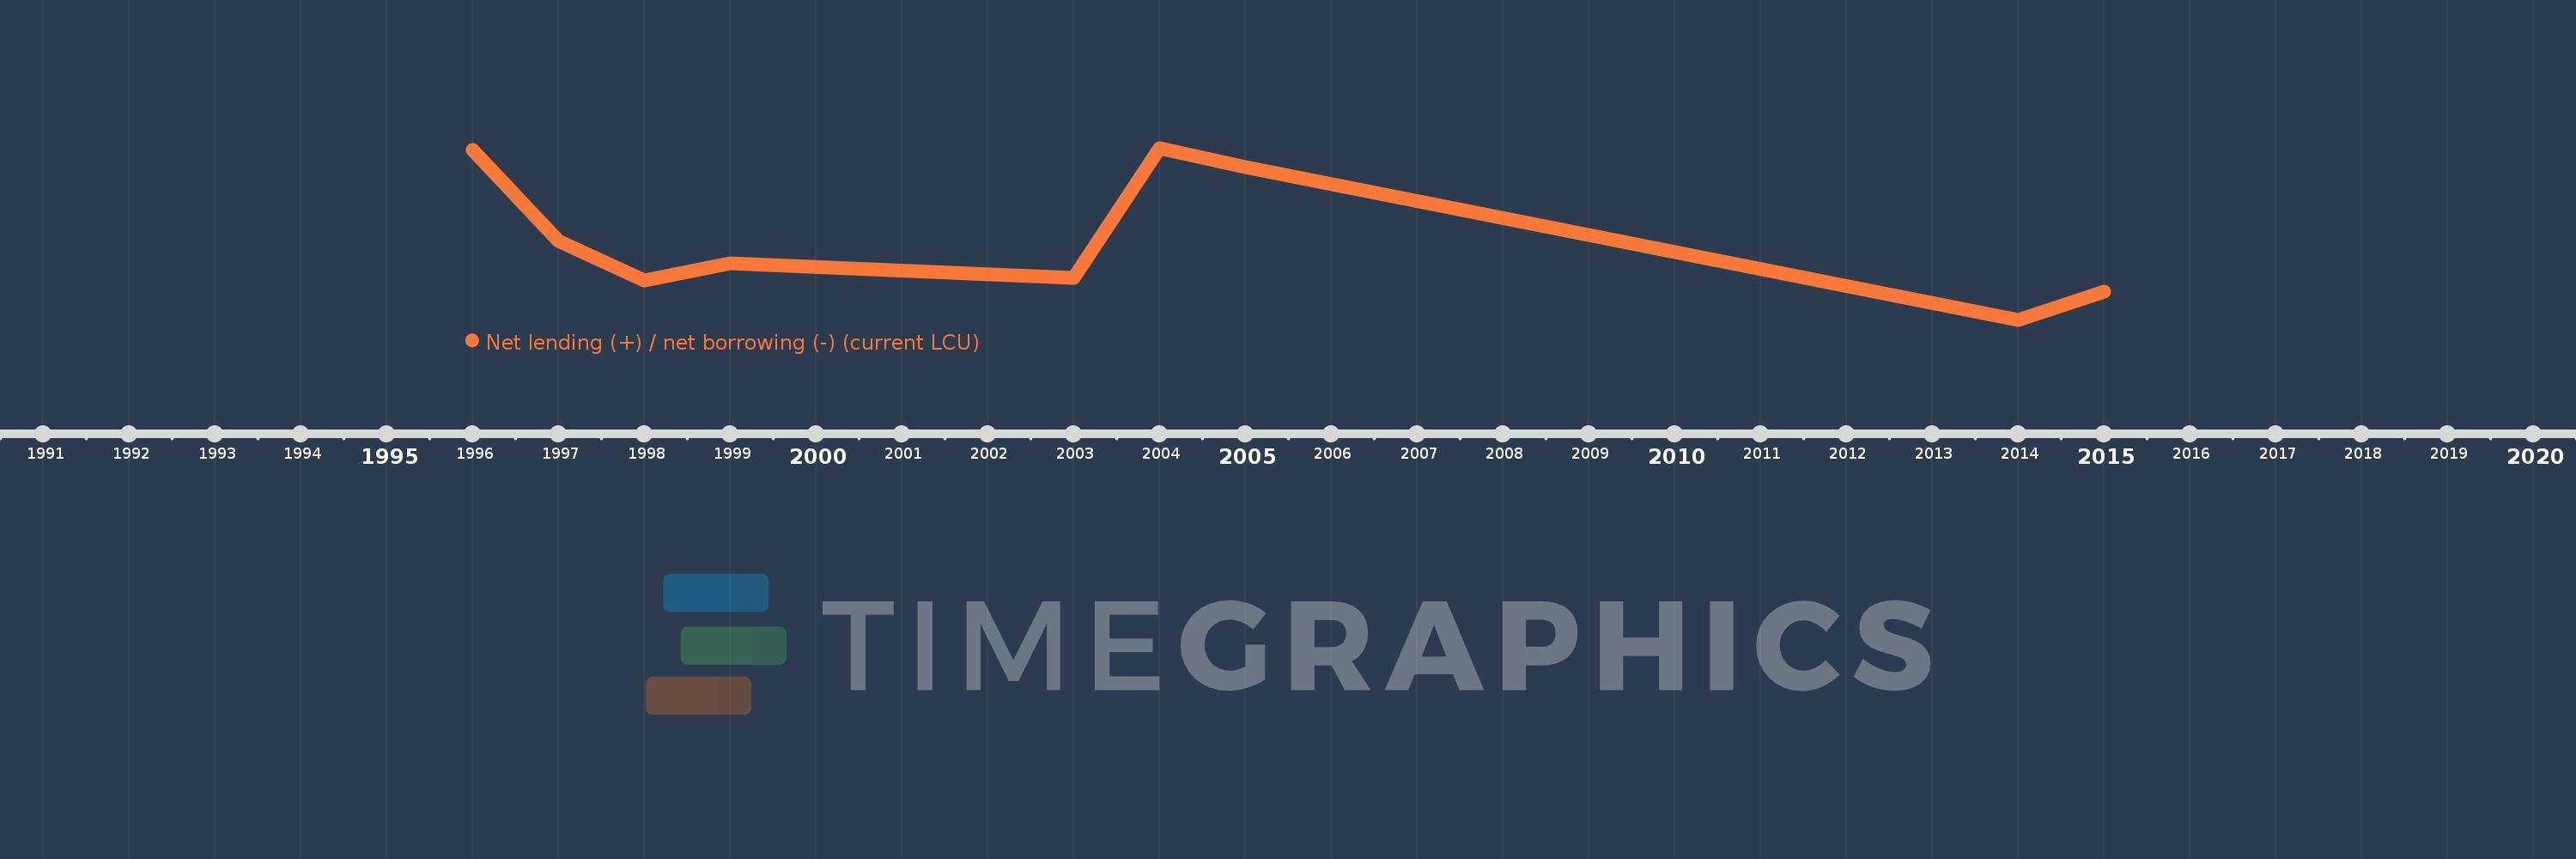
Net lending (+) / net borrowing (-) (current LCU)
2015,2014,2005,2004,2003,1999,1998,1997,1996
This statistics in other country:
AfghanistanAlbaniaAlgeriaAngolaAntigua and BarbudaArmeniaAustraliaAustriaAzerbaijanBahamas, TheBahrainBangladeshBarbadosBelarusBelgiumBelizeBhutanBoliviaBosnia and HerzegovinaBrazilBurundiCabo VerdeCambodiaCanadaCentral African RepublicChileCongo, Dem. Rep.Congo, Rep.Costa RicaCote d'IvoireCroatiaCyprusCzech RepublicDenmarkDominicaDominican RepublicEgypt, Arab Rep.El SalvadorEquatorial GuineaEstoniaEthiopiaFijiFinlandFranceGambia, TheGeorgiaGermanyGreeceGuatemalaHondurasHungaryIcelandIndiaIndonesiaIran, Islamic Rep.IraqIrelandIsraelItalyJamaicaKazakhstanKiribatiKorea, Rep.Kyrgyz RepublicLao PDRLatviaLebanonLithuaniaLuxembourgMacao SAR, ChinaMacedonia, FYRMadagascarMalawiMaldivesMaliMaltaMauritiusMexicoMicronesia, Fed. Sts.MoldovaMongoliaMoroccoMozambiqueNamibiaNepalNetherlandsNew ZealandNicaraguaNigeriaNorwayOmanPakistanParaguayPeruPhilippinesPolandPortugalQatarRomaniaRussian FederationRwandaSamoaSan MarinoSao Tome and PrincipeSenegalSerbiaSierra LeoneSingaporeSlovak RepublicSolomon IslandsSouth AfricaSpainSri LankaSurinameSwazilandSwedenSwitzerlandSyrian Arab RepublicThailandTimor-LesteTrinidad and TobagoTurkeyUgandaUkraineUnited Arab EmiratesUnited KingdomUnited StatesUruguayVanuatuVietnamWest Bank and GazaYemen, Rep.Zimbabwe Timeline:
This timeline shows a graph from 1996 to 2015 of Albania. No data until 1995. Number of actual observations by date: 9.
Source name:
World Development Indicators
Source organization:
International Monetary Fund, Government Finance Statistics Yearbook and data files.
Categories, topics:
Public Sector
Last updated:
apr 23, 2017
Indicators value changes by year
Minimum:
-48.572 bln
jan 1, 2014
Maximum:
-19.685 bln
jan 1, 2004
At the date of observation
Value
Absolute change
Change from previous value
jan 1, 1996
-20.021 bln
-20.021 bln
0.0%
jan 1, 1997
-35.28 bln
-15.259 bln
76.22%
jan 1, 1998
-41.963 bln
-6.683 bln
18.94%
jan 1, 1999
-39.105 bln
+2.858 bln
-6.81%
jan 1, 2003
-41.587 bln
-2.482 bln
6.35%
jan 1, 2004
-19.685 bln
+21.903 bln
-52.67%
jan 1, 2005
-22.865 bln
-3.181 bln
16.16%
jan 1, 2014
-48.572 bln
-25.707 bln
112.43%
jan 1, 2015
-43.869 bln
+4.703 bln
-9.68%
Ranking of countries by current statistics by years


Comments: