29
/
en
AIzaSyAYiBZKx7MnpbEhh9jyipgxe19OcubqV5w
April 1, 2024
258688
Syrian Arab Republic
SYR
true
2
1
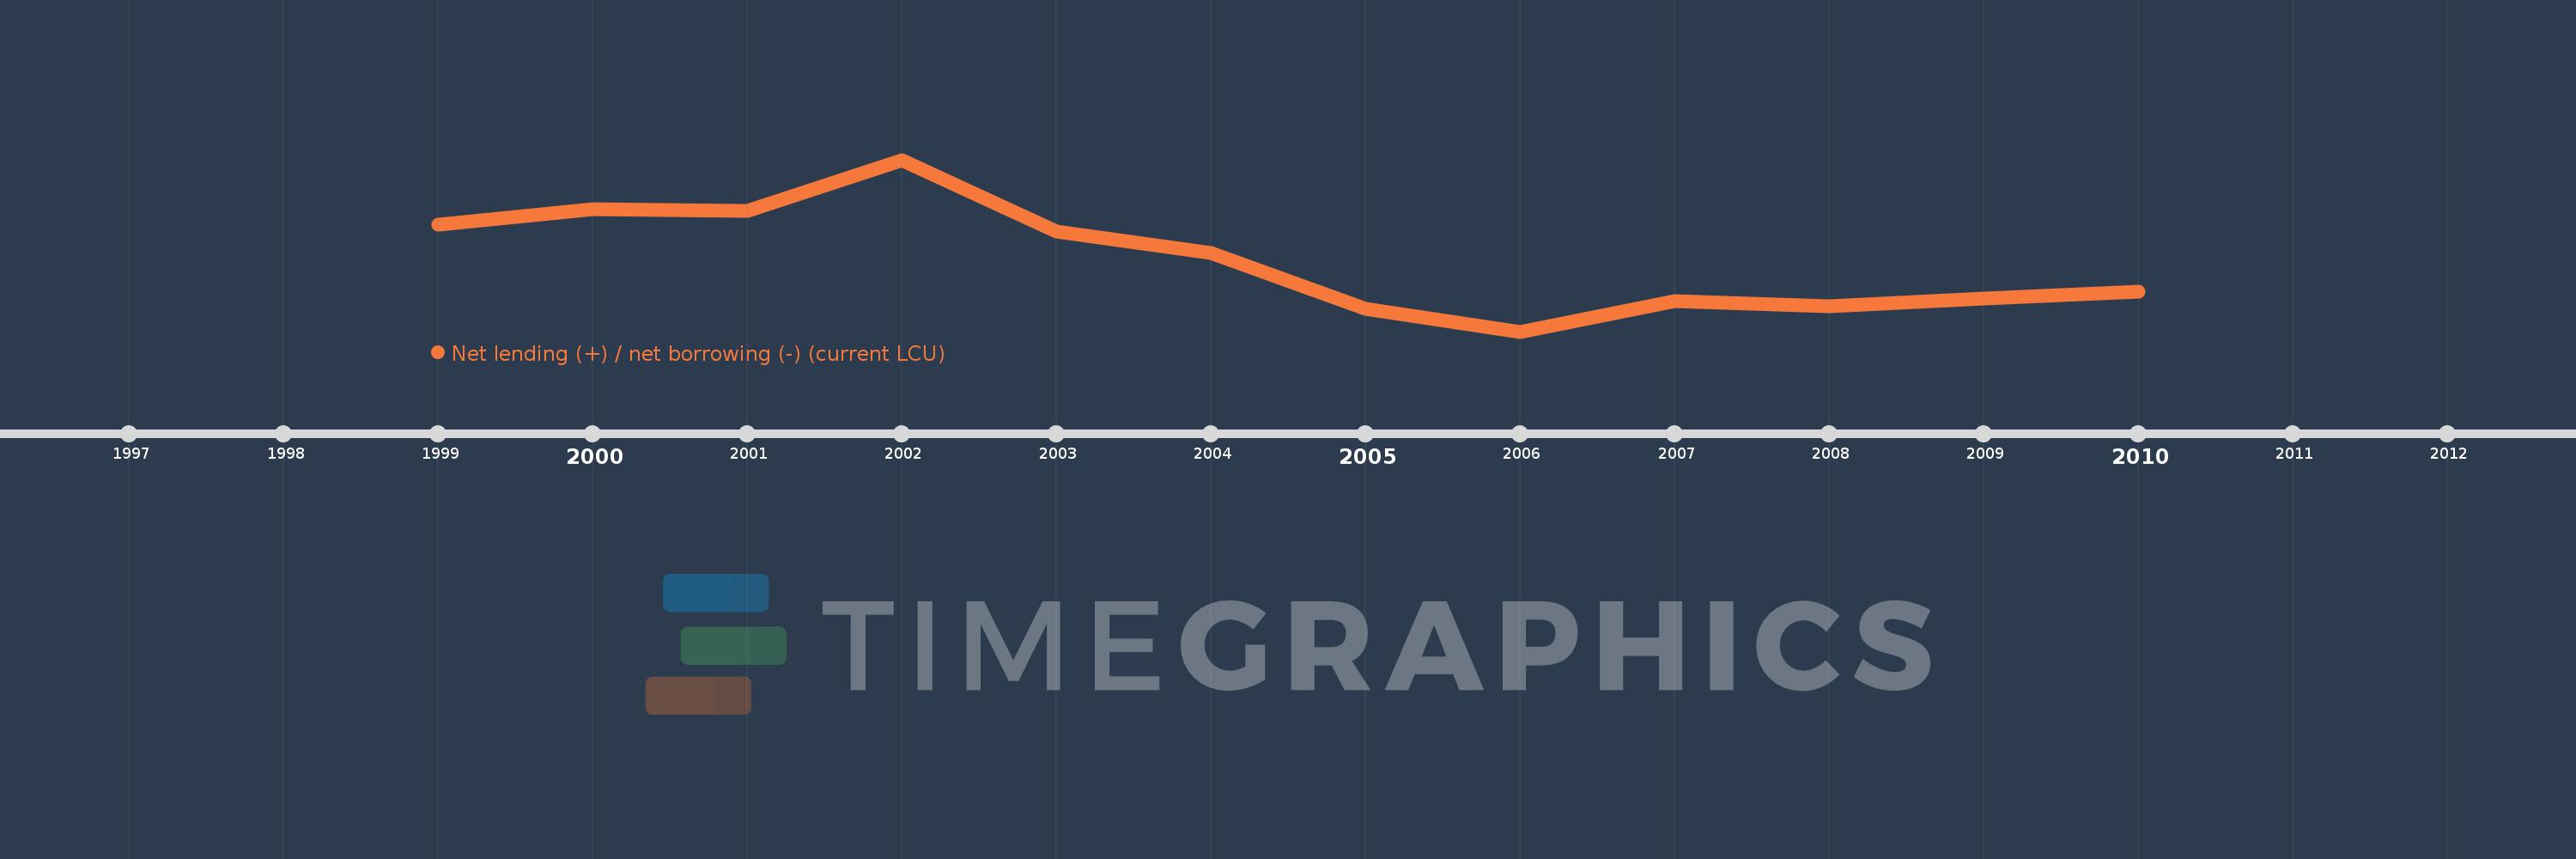
Net lending (+) / net borrowing (-) (current LCU)
2010,2009,2008,2007,2006,2005,2004,2003,2002,2001,2000,1999
This statistics in other country:
AfghanistanAlbaniaAlgeriaAngolaAntigua and BarbudaArmeniaAustraliaAustriaAzerbaijanBahamas, TheBahrainBangladeshBarbadosBelarusBelgiumBelizeBhutanBoliviaBosnia and HerzegovinaBrazilBurundiCabo VerdeCambodiaCanadaCentral African RepublicChileCongo, Dem. Rep.Congo, Rep.Costa RicaCote d'IvoireCroatiaCyprusCzech RepublicDenmarkDominicaDominican RepublicEgypt, Arab Rep.El SalvadorEquatorial GuineaEstoniaEthiopiaFijiFinlandFranceGambia, TheGeorgiaGermanyGreeceGuatemalaHondurasHungaryIcelandIndiaIndonesiaIran, Islamic Rep.IraqIrelandIsraelItalyJamaicaKazakhstanKiribatiKorea, Rep.Kyrgyz RepublicLao PDRLatviaLebanonLithuaniaLuxembourgMacao SAR, ChinaMacedonia, FYRMadagascarMalawiMaldivesMaliMaltaMauritiusMexicoMicronesia, Fed. Sts.MoldovaMongoliaMoroccoMozambiqueNamibiaNepalNetherlandsNew ZealandNicaraguaNigeriaNorwayOmanPakistanParaguayPeruPhilippinesPolandPortugalQatarRomaniaRussian FederationRwandaSamoaSan MarinoSao Tome and PrincipeSenegalSerbiaSierra LeoneSingaporeSlovak RepublicSolomon IslandsSouth AfricaSpainSri LankaSurinameSwazilandSwedenSwitzerlandSyrian Arab RepublicThailandTimor-LesteTrinidad and TobagoTurkeyUgandaUkraineUnited Arab EmiratesUnited KingdomUnited StatesUruguayVanuatuVietnamWest Bank and GazaYemen, Rep.Zimbabwe Timeline:
This timeline shows a graph from 1999 to 2010 of Syrian Arab Republic. No data until 1998. Number of actual observations by date: 12.
Source name:
World Development Indicators
Source organization:
International Monetary Fund, Government Finance Statistics Yearbook and data files.
Categories, topics:
Public Sector
Last updated:
apr 23, 2017
Indicators value changes by year
Minimum:
-75.112 bln
jan 1, 2006
Maximum:
17.094 bln
jan 1, 2002
At the date of observation
Value
Absolute change
Change from previous value
jan 1, 1999
-17.935 bln
-17.935 bln
0.0%
jan 1, 2000
-9.218 bln
+8.717 bln
-48.6%
jan 1, 2001
-10.174 bln
-956.0 mln
10.37%
jan 1, 2002
17.094 bln
+27.268 bln
-268.02%
jan 1, 2003
-21.392 bln
-38.486 bln
-225.14%
jan 1, 2004
-32.712 bln
-11.32 bln
52.92%
jan 1, 2005
-62.68 bln
-29.968 bln
91.61%
jan 1, 2006
-75.112 bln
-12.432 bln
19.83%
jan 1, 2007
-58.835 bln
+16.277 bln
-21.67%
jan 1, 2008
-61.701 bln
-2.866 bln
4.87%
jan 1, 2009
-57.49 bln
+4.211 bln
-6.82%
jan 1, 2010
-53.742 bln
+3.748 bln
-6.52%
Ranking of countries by current statistics by years


Comments: