29
/
en
AIzaSyAYiBZKx7MnpbEhh9jyipgxe19OcubqV5w
April 1, 2024
213349
Nigeria
NGA
true
2
1
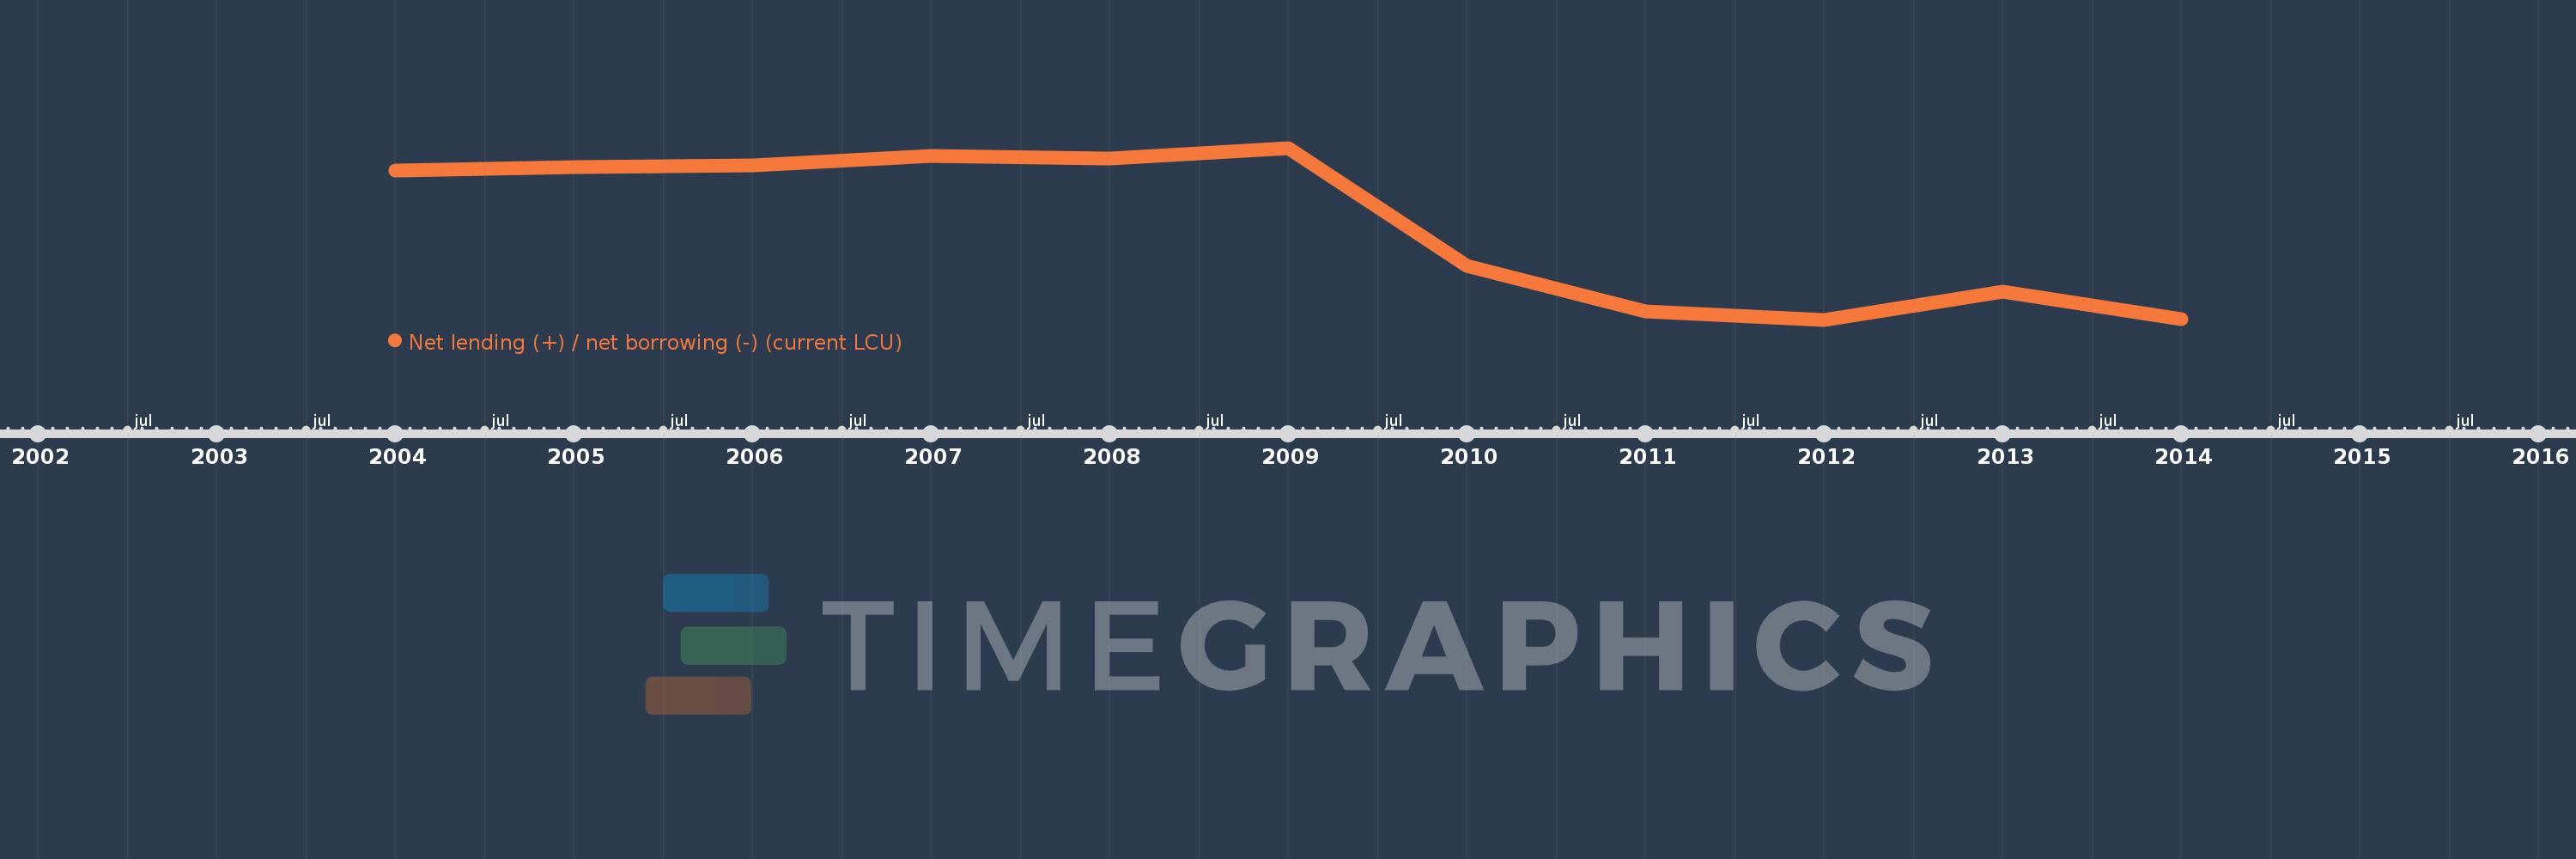
Net lending (+) / net borrowing (-) (current LCU)
2014,2013,2012,2011,2010,2009,2008,2007,2006,2005,2004
This statistics in other country:
AfghanistanAlbaniaAlgeriaAngolaAntigua and BarbudaArmeniaAustraliaAustriaAzerbaijanBahamas, TheBahrainBangladeshBarbadosBelarusBelgiumBelizeBhutanBoliviaBosnia and HerzegovinaBrazilBurundiCabo VerdeCambodiaCanadaCentral African RepublicChileCongo, Dem. Rep.Congo, Rep.Costa RicaCote d'IvoireCroatiaCyprusCzech RepublicDenmarkDominicaDominican RepublicEgypt, Arab Rep.El SalvadorEquatorial GuineaEstoniaEthiopiaFijiFinlandFranceGambia, TheGeorgiaGermanyGreeceGuatemalaHondurasHungaryIcelandIndiaIndonesiaIran, Islamic Rep.IraqIrelandIsraelItalyJamaicaKazakhstanKiribatiKorea, Rep.Kyrgyz RepublicLao PDRLatviaLebanonLithuaniaLuxembourgMacao SAR, ChinaMacedonia, FYRMadagascarMalawiMaldivesMaliMaltaMauritiusMexicoMicronesia, Fed. Sts.MoldovaMongoliaMoroccoMozambiqueNamibiaNepalNetherlandsNew ZealandNicaraguaNigeriaNorwayOmanPakistanParaguayPeruPhilippinesPolandPortugalQatarRomaniaRussian FederationRwandaSamoaSan MarinoSao Tome and PrincipeSenegalSerbiaSierra LeoneSingaporeSlovak RepublicSolomon IslandsSouth AfricaSpainSri LankaSurinameSwazilandSwedenSwitzerlandSyrian Arab RepublicThailandTimor-LesteTrinidad and TobagoTurkeyUgandaUkraineUnited Arab EmiratesUnited KingdomUnited StatesUruguayVanuatuVietnamWest Bank and GazaYemen, Rep.Zimbabwe Timeline:
This timeline shows a graph from 2004 to 2014 of Nigeria. No data until 2003. Number of actual observations by date: 11.
Source name:
World Development Indicators
Source organization:
International Monetary Fund, Government Finance Statistics Yearbook and data files.
Categories, topics:
Public Sector
Last updated:
apr 23, 2017
Indicators value changes by year
Minimum:
-1.159 trl
jan 1, 2012
Maximum:
-47.4 bln
jan 1, 2009
At the date of observation
Value
Absolute change
Change from previous value
jan 1, 2004
-191.5 bln
-191.5 bln
0.0%
jan 1, 2005
-172.7 bln
+18.8 bln
-9.82%
jan 1, 2006
-161.5 bln
+11.2 bln
-6.49%
jan 1, 2007
-100.9 bln
+60.6 bln
-37.52%
jan 1, 2008
-117.2 bln
-16.3 bln
16.15%
jan 1, 2009
-47.4 bln
+69.8 bln
-59.56%
jan 1, 2010
-810.0 bln
-762.6 bln
1.61K%
jan 1, 2011
-1.105 trl
-295.5 bln
36.48%
jan 1, 2012
-1.159 trl
-53.2 bln
4.81%
jan 1, 2013
-975.5 bln
+183.2 bln
-15.81%
jan 1, 2014
-1.153 trl
-177.9 bln
18.24%
Ranking of countries by current statistics by years


Comments: