29
/
en
AIzaSyAYiBZKx7MnpbEhh9jyipgxe19OcubqV5w
April 1, 2024
176779
Lebanon
LBN
true
2
1
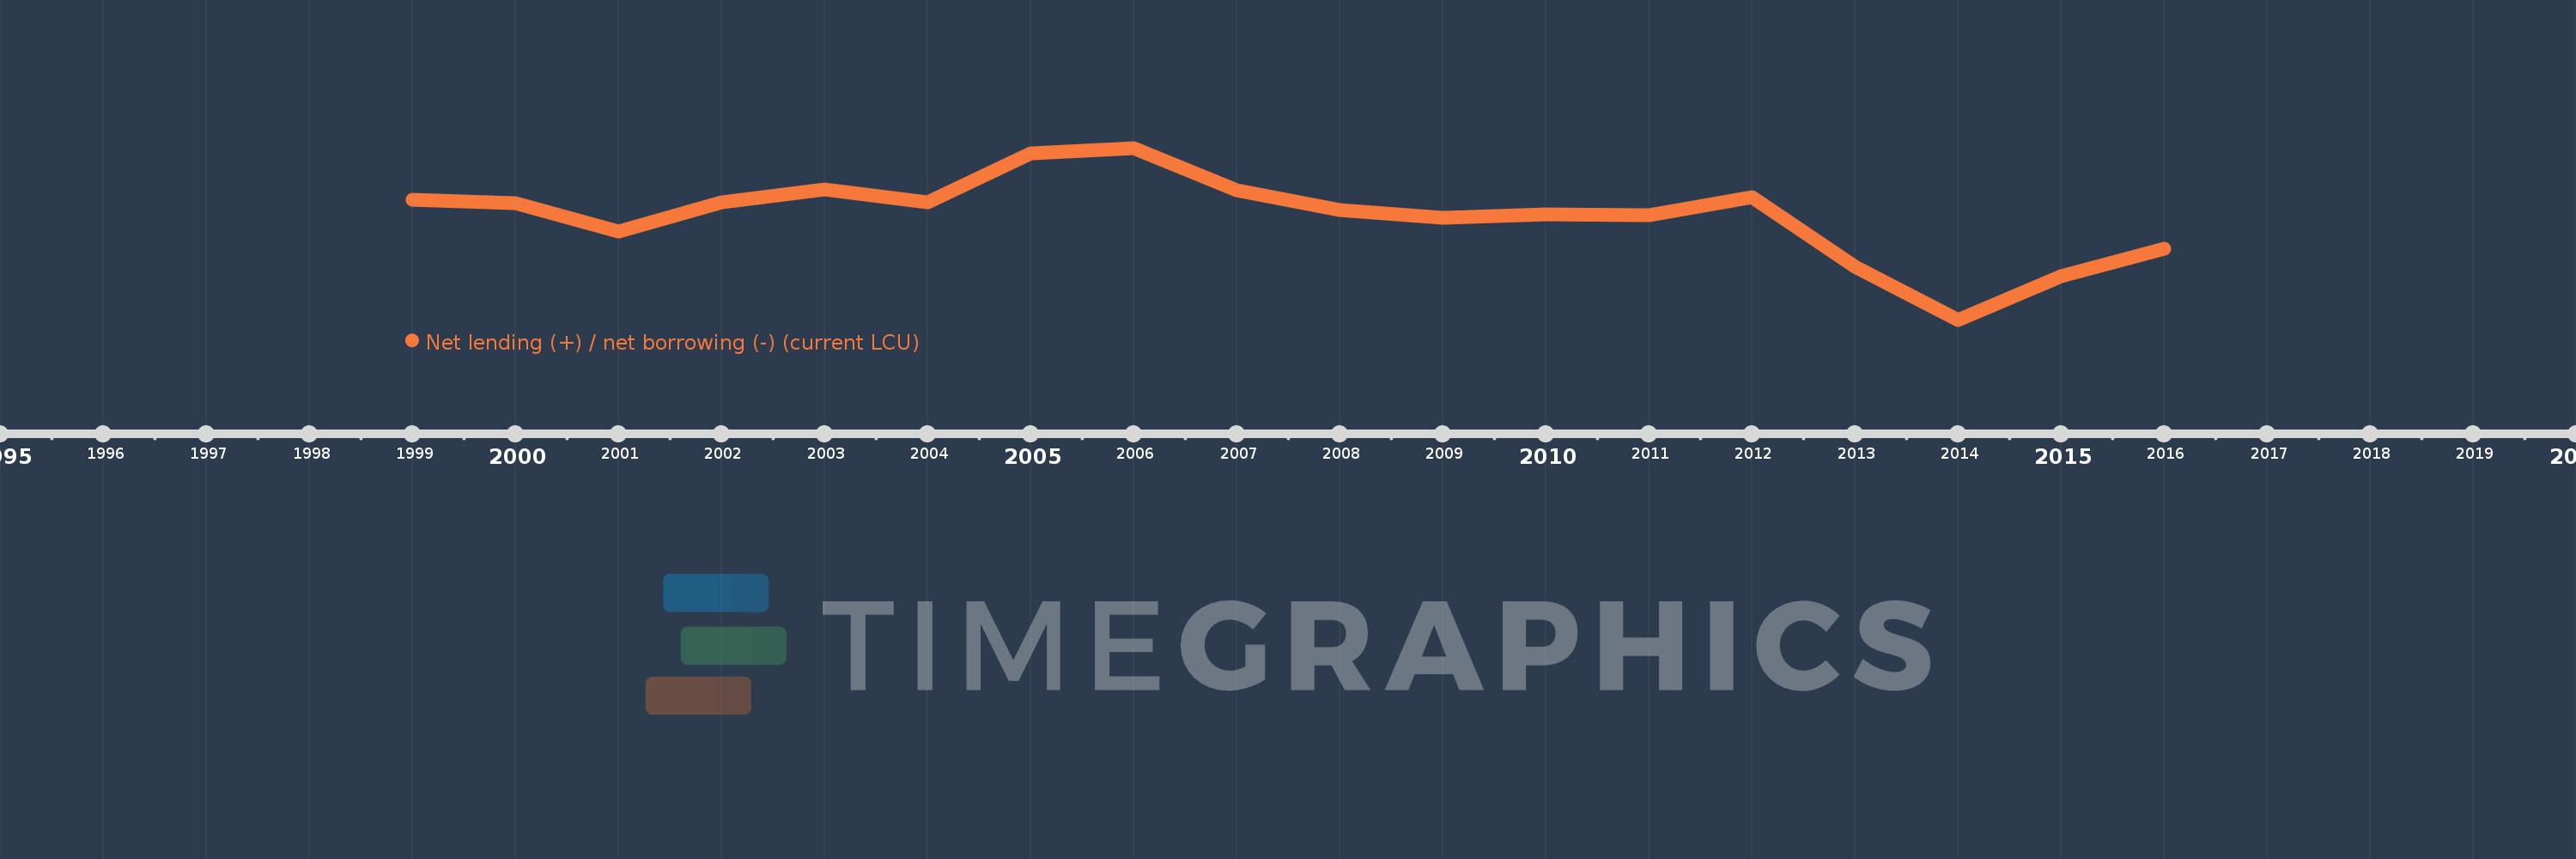
Net lending (+) / net borrowing (-) (current LCU)
2016,2015,2014,2013,2012,2011,2010,2009,2008,2007,2006,2005,2004,2003,2002,2001,2000,1999
This statistics in other country:
AfghanistanAlbaniaAlgeriaAngolaAntigua and BarbudaArmeniaAustraliaAustriaAzerbaijanBahamas, TheBahrainBangladeshBarbadosBelarusBelgiumBelizeBhutanBoliviaBosnia and HerzegovinaBrazilBurundiCabo VerdeCambodiaCanadaCentral African RepublicChileCongo, Dem. Rep.Congo, Rep.Costa RicaCote d'IvoireCroatiaCyprusCzech RepublicDenmarkDominicaDominican RepublicEgypt, Arab Rep.El SalvadorEquatorial GuineaEstoniaEthiopiaFijiFinlandFranceGambia, TheGeorgiaGermanyGreeceGuatemalaHondurasHungaryIcelandIndiaIndonesiaIran, Islamic Rep.IraqIrelandIsraelItalyJamaicaKazakhstanKiribatiKorea, Rep.Kyrgyz RepublicLao PDRLatviaLebanonLithuaniaLuxembourgMacao SAR, ChinaMacedonia, FYRMadagascarMalawiMaldivesMaliMaltaMauritiusMexicoMicronesia, Fed. Sts.MoldovaMongoliaMoroccoMozambiqueNamibiaNepalNetherlandsNew ZealandNicaraguaNigeriaNorwayOmanPakistanParaguayPeruPhilippinesPolandPortugalQatarRomaniaRussian FederationRwandaSamoaSan MarinoSao Tome and PrincipeSenegalSerbiaSierra LeoneSingaporeSlovak RepublicSolomon IslandsSouth AfricaSpainSri LankaSurinameSwazilandSwedenSwitzerlandSyrian Arab RepublicThailandTimor-LesteTrinidad and TobagoTurkeyUgandaUkraineUnited Arab EmiratesUnited KingdomUnited StatesUruguayVanuatuVietnamWest Bank and GazaYemen, Rep.Zimbabwe Timeline:
This timeline shows a graph from 1999 to 2016 of Lebanon. No data until 1998. Number of actual observations by date: 18.
Source name:
World Development Indicators
Source organization:
International Monetary Fund, Government Finance Statistics Yearbook and data files.
Categories, topics:
Public Sector
Last updated:
apr 23, 2017
Indicators value changes by year
Minimum:
-7.103 trl
jan 1, 2014
Maximum:
-2.582 trl
jan 1, 2006
At the date of observation
Value
Absolute change
Change from previous value
jan 1, 1999
-3.936 trl
-3.936 trl
0.0%
jan 1, 2000
-4.03 trl
-93.693 bln
2.38%
jan 1, 2001
-4.788 trl
-758.53 bln
18.82%
jan 1, 2002
-4.003 trl
+785.0 bln
-16.39%
jan 1, 2003
-3.67 trl
+332.9 bln
-8.32%
jan 1, 2004
-4.012 trl
-341.378 bln
9.3%
jan 1, 2005
-2.735 trl
+1.277 trl
-31.83%
jan 1, 2006
-2.582 trl
+152.404 bln
-5.57%
jan 1, 2007
-3.7 trl
-1.118 trl
43.29%
jan 1, 2008
-4.21 trl
-509.467 bln
13.77%
jan 1, 2009
-4.413 trl
-203.346 bln
4.83%
jan 1, 2010
-4.336 trl
+77.45 bln
-1.76%
jan 1, 2011
-4.348 trl
-12.659 bln
0.29%
jan 1, 2012
-3.879 trl
+469.61 bln
-10.8%
jan 1, 2013
-5.719 trl
-1.84 trl
47.45%
jan 1, 2014
-7.103 trl
-1.384 trl
24.21%
jan 1, 2015
-5.966 trl
+1.137 trl
-16.01%
jan 1, 2016
-5.229 trl
+736.999 bln
-12.35%
Ranking of countries by current statistics by years


Comments: