30
/
AIzaSyAYiBZKx7MnpbEhh9jyipgxe19OcubqV5w
April 1, 2024
230139
Russian Federation
RUS
true
2
1
Net lending (+) / net borrowing (-) (current LCU)
2016,2015,2014,2013,2012,2011,2010,2009,2008,2007,2006,2005,2004,2003,2002,2001,2000,1999,1996,1995
Public Timelines
FAQ
Menu
Public Timelines
FAQ
For education
For educational institutions
For teachers
For students
Open cabinet
Create
Close
Create a timeline
Public timelines
Library
FAQ
Download
Global statistics library
→
Russian Federation
→
Net lending (+) / net borrowing (-) (current LCU)
This statistics in other country:
Afghanistan
Albania
Algeria
Angola
Antigua and Barbuda
Armenia
Australia
Austria
Azerbaijan
Bahamas, The
Bahrain
Bangladesh
Barbados
Belarus
Belgium
Belize
Bhutan
Bolivia
Bosnia and Herzegovina
Brazil
Burundi
Cabo Verde
Cambodia
Canada
Central African Republic
Chile
Congo, Dem. Rep.
Congo, Rep.
Costa Rica
Cote d'Ivoire
Croatia
Cyprus
Czech Republic
Denmark
Dominica
Dominican Republic
Egypt, Arab Rep.
El Salvador
Equatorial Guinea
Estonia
Ethiopia
Fiji
Finland
France
Gambia, The
Georgia
Germany
Greece
Guatemala
Honduras
Hungary
Iceland
India
Indonesia
Iran, Islamic Rep.
Iraq
Ireland
Israel
Italy
Jamaica
Kazakhstan
Kiribati
Korea, Rep.
Kyrgyz Republic
Lao PDR
Latvia
Lebanon
Lithuania
Luxembourg
Macao SAR, China
Macedonia, FYR
Madagascar
Malawi
Maldives
Mali
Malta
Mauritius
Mexico
Micronesia, Fed. Sts.
Moldova
Mongolia
Morocco
Mozambique
Namibia
Nepal
Netherlands
New Zealand
Nicaragua
Nigeria
Norway
Oman
Pakistan
Paraguay
Peru
Philippines
Poland
Portugal
Qatar
Romania
Russian Federation
Rwanda
Samoa
San Marino
Sao Tome and Principe
Senegal
Serbia
Sierra Leone
Singapore
Slovak Republic
Solomon Islands
South Africa
Spain
Sri Lanka
Suriname
Swaziland
Sweden
Switzerland
Syrian Arab Republic
Thailand
Timor-Leste
Trinidad and Tobago
Turkey
Uganda
Ukraine
United Arab Emirates
United Kingdom
United States
Uruguay
Vanuatu
Vietnam
West Bank and Gaza
Yemen, Rep.
Zimbabwe
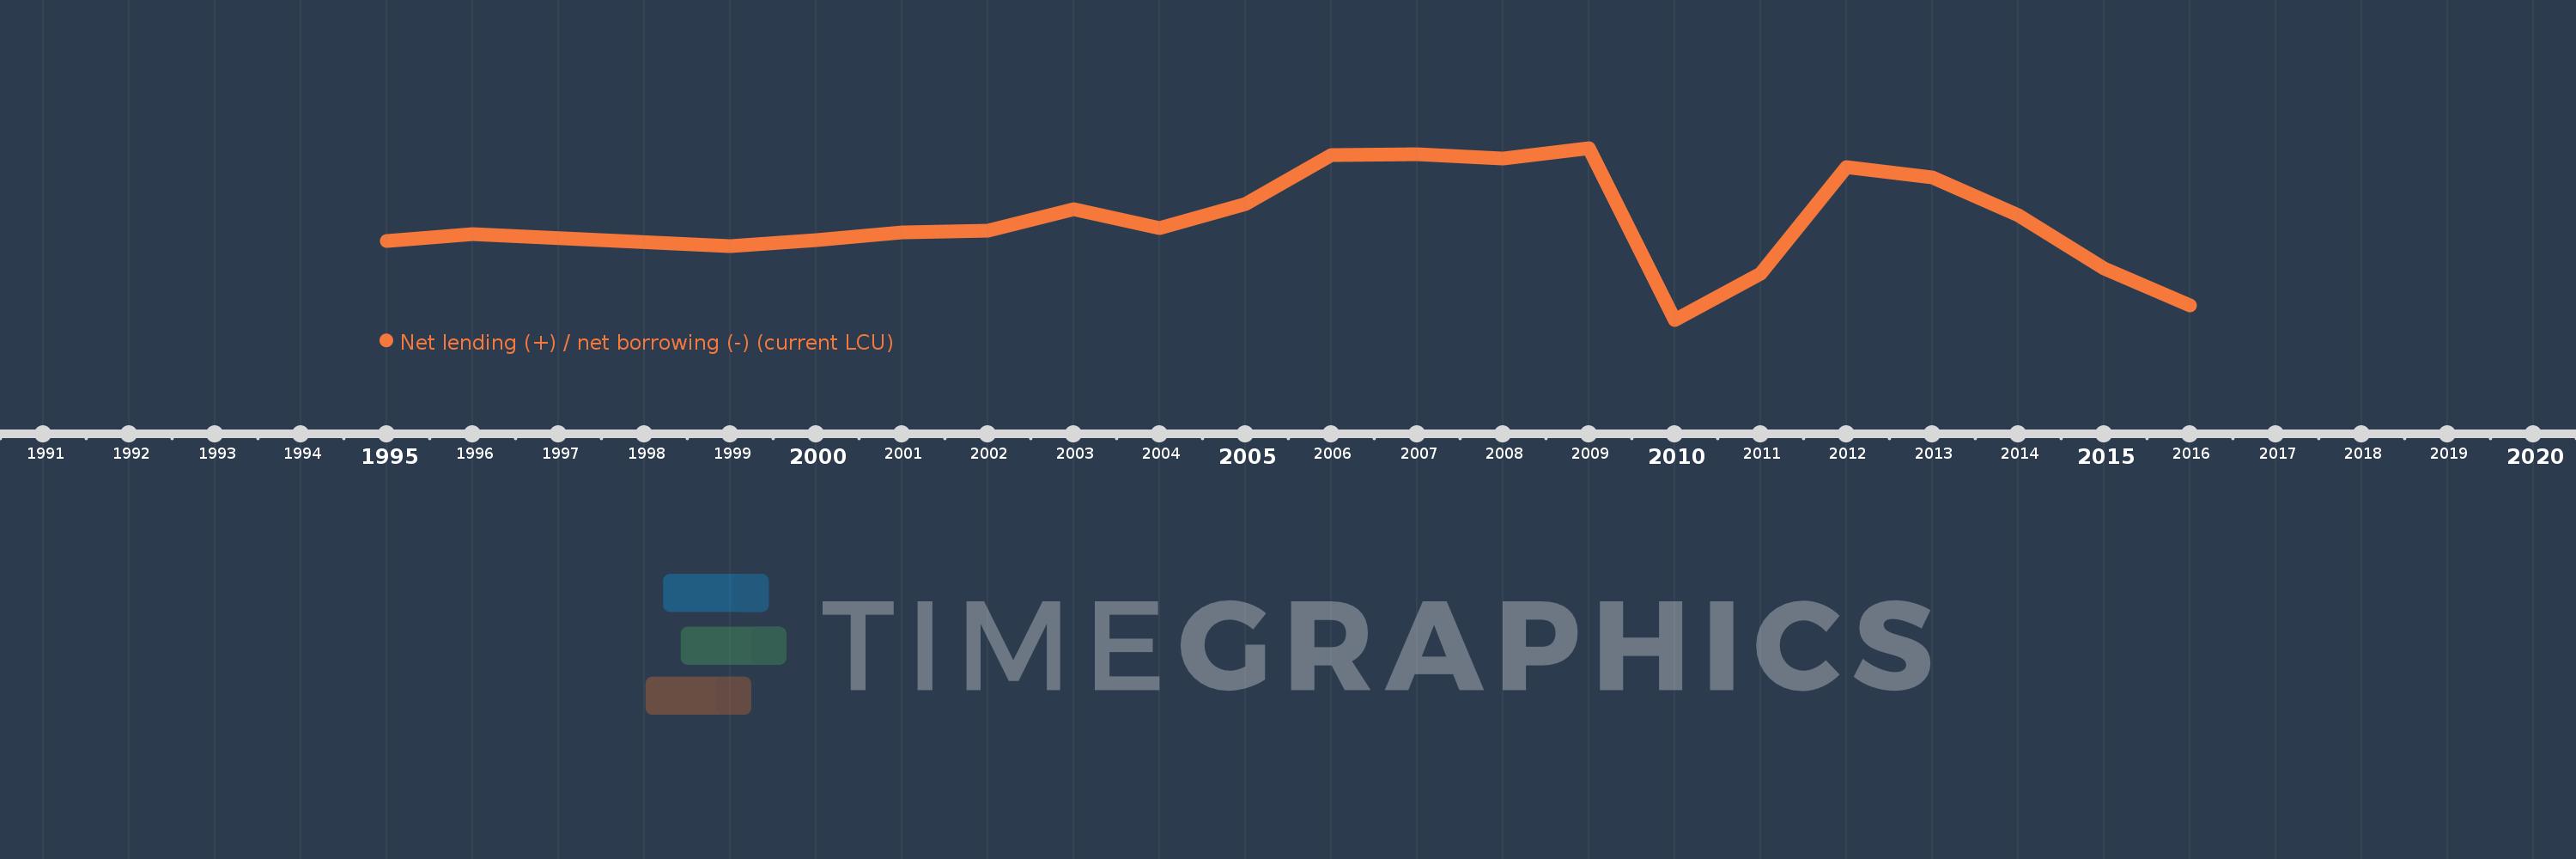
Timeline:
This timeline shows a graph from
1995
to
2016
of Russian Federation. No data until
1994
. Number of actual observations by date:
20
.
Source name:
World Development Indicators
Source organization:
International Monetary Fund, Government Finance Statistics Yearbook and data files.
Categories, topics:
Public Sector
Last updated:
apr 23, 2017
Indicators value changes by year
Meaning:
485.057 bln
Minimum:
-2.031 trl
jan 1, 2010
Maximum:
2.32 trl
jan 1, 2009
At the date of observation
Value
Absolute change
Change from the previous value
jan 1, 1995
-42.714 bln
-42.714 bln
0.0%
jan 1, 1996
133.152 bln
+175.866 bln
-411.73%
jan 1, 1999
-164.502 bln
-297.654 bln
-223.54%
jan 1, 2000
-5.704 bln
+158.798 bln
-96.53%
jan 1, 2001
180.392 bln
+186.096 bln
-3.26K%
jan 1, 2002
235.24 bln
+54.848 bln
30.4%
jan 1, 2003
760.634 bln
+525.394 bln
223.34%
jan 1, 2004
291.579 bln
-469.055 bln
-61.67%
jan 1, 2005
899.192 bln
+607.613 bln
208.39%
jan 1, 2006
2.136 trl
+1.237 trl
137.51%
jan 1, 2007
2.16 trl
+24.692 bln
1.16%
jan 1, 2008
2.057 trl
-103.7 bln
-4.8%
jan 1, 2009
2.32 trl
+263.0 bln
12.79%
jan 1, 2010
-2.031 trl
-4.351 trl
-187.55%
jan 1, 2011
-865.9 bln
+1.165 trl
-57.36%
jan 1, 2012
1.837 trl
+2.703 trl
-312.21%
jan 1, 2013
1.566 trl
-271.3 bln
-14.76%
jan 1, 2014
622.8 bln
-943.4 bln
-60.23%
jan 1, 2015
-729.255 bln
-1.352 trl
-217.09%
jan 1, 2016
-1.659 trl
-929.92 bln
127.52%
Ranking of countries by current statistics by years
About & Feedback
Terms
Privacy
Library
2024
©
Time.Graphics
Support 24/7
Cabinet
Get premium
Donate
The service accepts bank transfer (ACH, Wire) or cards (Visa, MasterCard, etc). Processed by Stripe.
Secured with SSL
Excellent (Trustpilot Reviews)
Based on 115+ reviews
Write your own review on
Trustpilot.com
