29
/
en
AIzaSyAYiBZKx7MnpbEhh9jyipgxe19OcubqV5w
April 1, 2024
66389
Algeria
DZA
true
2
1
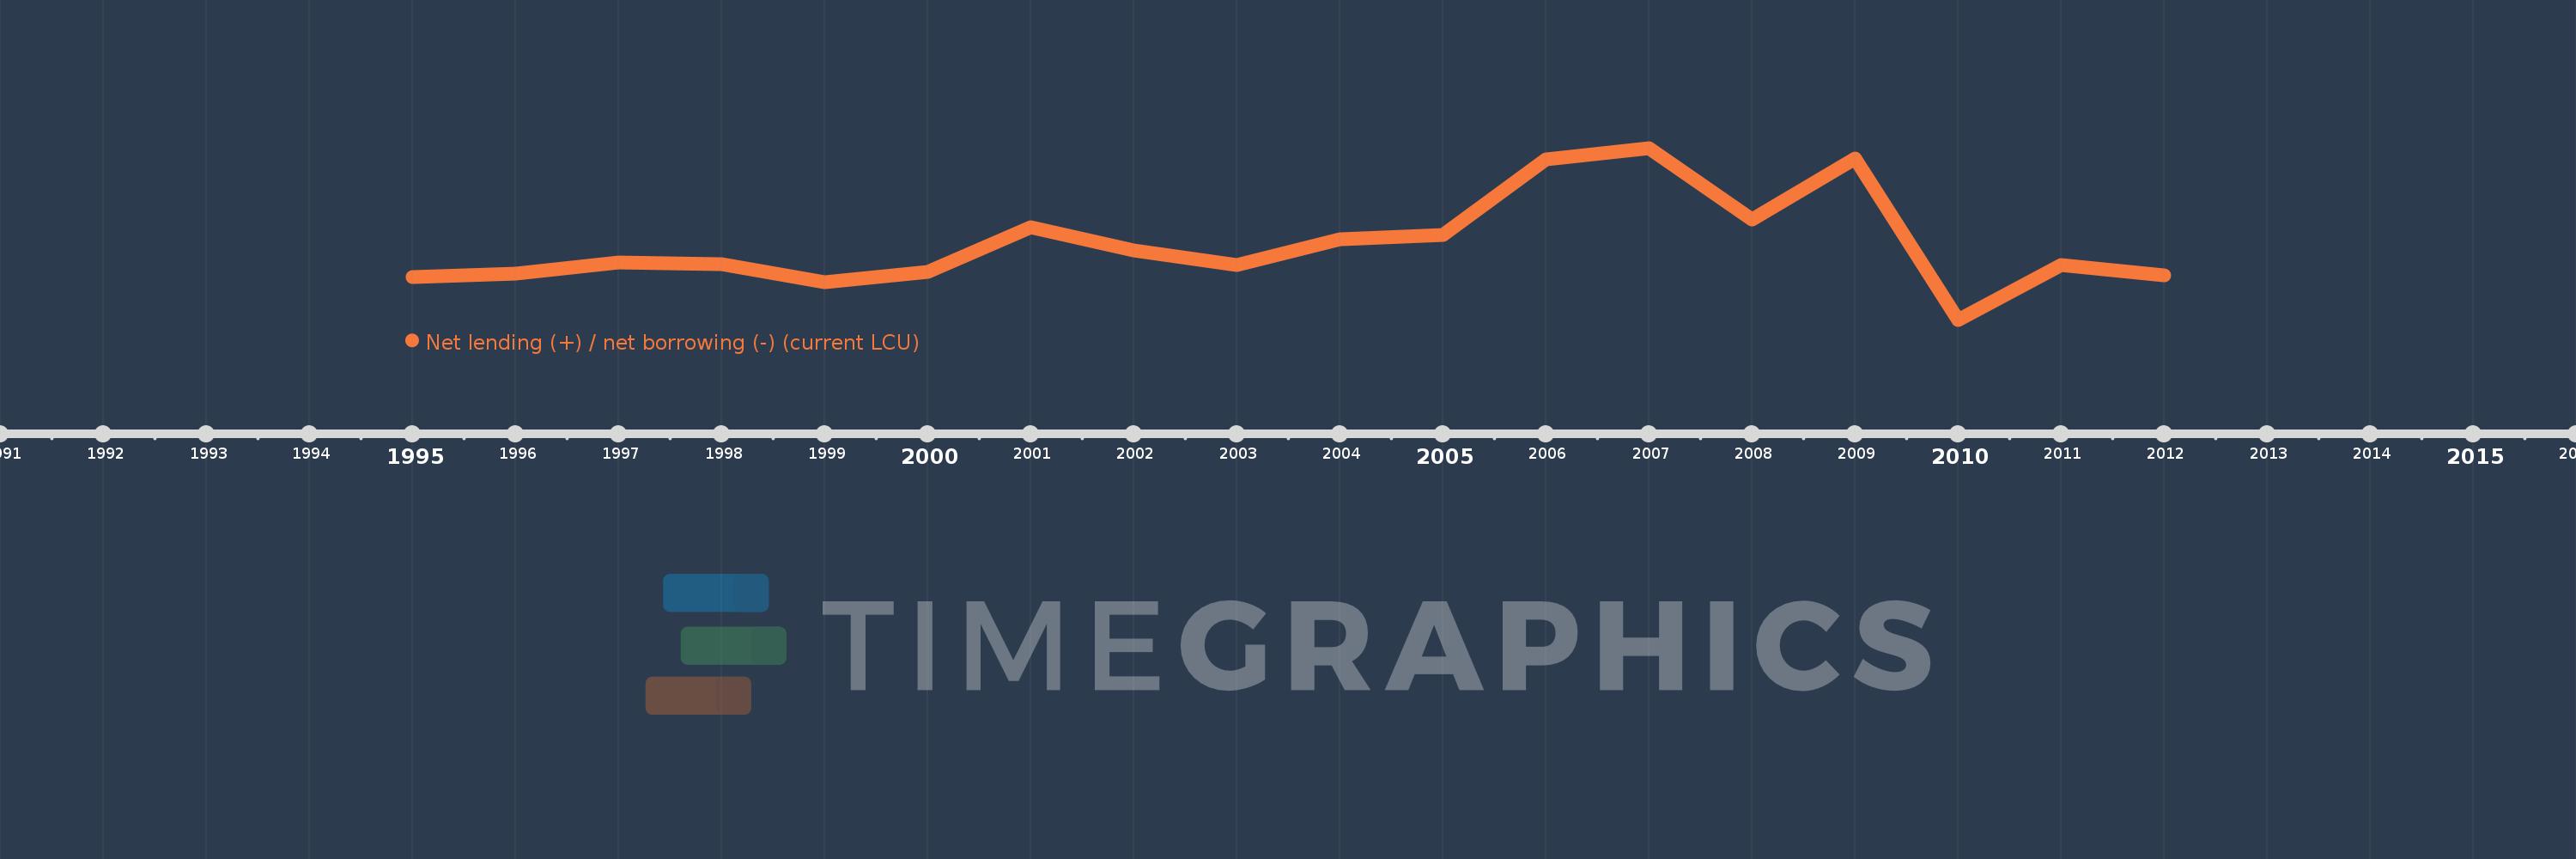
Net lending (+) / net borrowing (-) (current LCU)
2012,2011,2010,2009,2008,2007,2006,2005,2004,2003,2002,2001,2000,1999,1998,1997,1996,1995
This statistics in other country:
AfghanistanAlbaniaAlgeriaAngolaAntigua and BarbudaArmeniaAustraliaAustriaAzerbaijanBahamas, TheBahrainBangladeshBarbadosBelarusBelgiumBelizeBhutanBoliviaBosnia and HerzegovinaBrazilBurundiCabo VerdeCambodiaCanadaCentral African RepublicChileCongo, Dem. Rep.Congo, Rep.Costa RicaCote d'IvoireCroatiaCyprusCzech RepublicDenmarkDominicaDominican RepublicEgypt, Arab Rep.El SalvadorEquatorial GuineaEstoniaEthiopiaFijiFinlandFranceGambia, TheGeorgiaGermanyGreeceGuatemalaHondurasHungaryIcelandIndiaIndonesiaIran, Islamic Rep.IraqIrelandIsraelItalyJamaicaKazakhstanKiribatiKorea, Rep.Kyrgyz RepublicLao PDRLatviaLebanonLithuaniaLuxembourgMacao SAR, ChinaMacedonia, FYRMadagascarMalawiMaldivesMaliMaltaMauritiusMexicoMicronesia, Fed. Sts.MoldovaMongoliaMoroccoMozambiqueNamibiaNepalNetherlandsNew ZealandNicaraguaNigeriaNorwayOmanPakistanParaguayPeruPhilippinesPolandPortugalQatarRomaniaRussian FederationRwandaSamoaSan MarinoSao Tome and PrincipeSenegalSerbiaSierra LeoneSingaporeSlovak RepublicSolomon IslandsSouth AfricaSpainSri LankaSurinameSwazilandSwedenSwitzerlandSyrian Arab RepublicThailandTimor-LesteTrinidad and TobagoTurkeyUgandaUkraineUnited Arab EmiratesUnited KingdomUnited StatesUruguayVanuatuVietnamWest Bank and GazaYemen, Rep.Zimbabwe Timeline:
This timeline shows a graph from 1995 to 2012 of Algeria. No data until 1994. Number of actual observations by date: 18.
Source name:
World Development Indicators
Source organization:
International Monetary Fund, Government Finance Statistics Yearbook and data files.
Categories, topics:
Public Sector
Last updated:
apr 23, 2017
Indicators value changes by year
Minimum:
-447.741 bln
jan 1, 2010
Maximum:
1.121 trl
jan 1, 2007
At the date of observation
Value
Absolute change
Change from previous value
jan 1, 1995
-59.427 bln
-59.427 bln
0.0%
jan 1, 1996
-25.118 bln
+34.309 bln
-57.73%
jan 1, 1997
76.148 bln
+101.266 bln
-403.16%
jan 1, 1998
63.472 bln
-12.676 bln
-16.65%
jan 1, 1999
-101.228 bln
-164.7 bln
-259.48%
jan 1, 2000
-11.186 bln
+90.042 bln
-88.95%
jan 1, 2001
400.039 bln
+411.225 bln
-3.68K%
jan 1, 2002
184.5 bln
-215.539 bln
-53.88%
jan 1, 2003
52.6 bln
-131.9 bln
-71.49%
jan 1, 2004
289.232 bln
+236.632 bln
449.87%
jan 1, 2005
326.475 bln
+37.243 bln
12.88%
jan 1, 2006
1.013 trl
+686.443 bln
210.26%
jan 1, 2007
1.121 trl
+107.642 bln
10.63%
jan 1, 2008
465.3 bln
-655.26 bln
-58.48%
jan 1, 2009
1.025 trl
+559.46 bln
120.24%
jan 1, 2010
-447.741 bln
-1.473 trl
-143.69%
jan 1, 2011
48.83 bln
+496.571 bln
-110.91%
jan 1, 2012
-41.27 bln
-90.1 bln
-184.52%
Ranking of countries by current statistics by years


Comments: