29
/
en
AIzaSyAYiBZKx7MnpbEhh9jyipgxe19OcubqV5w
April 1, 2024
221600
Paraguay
PRY
true
2
1
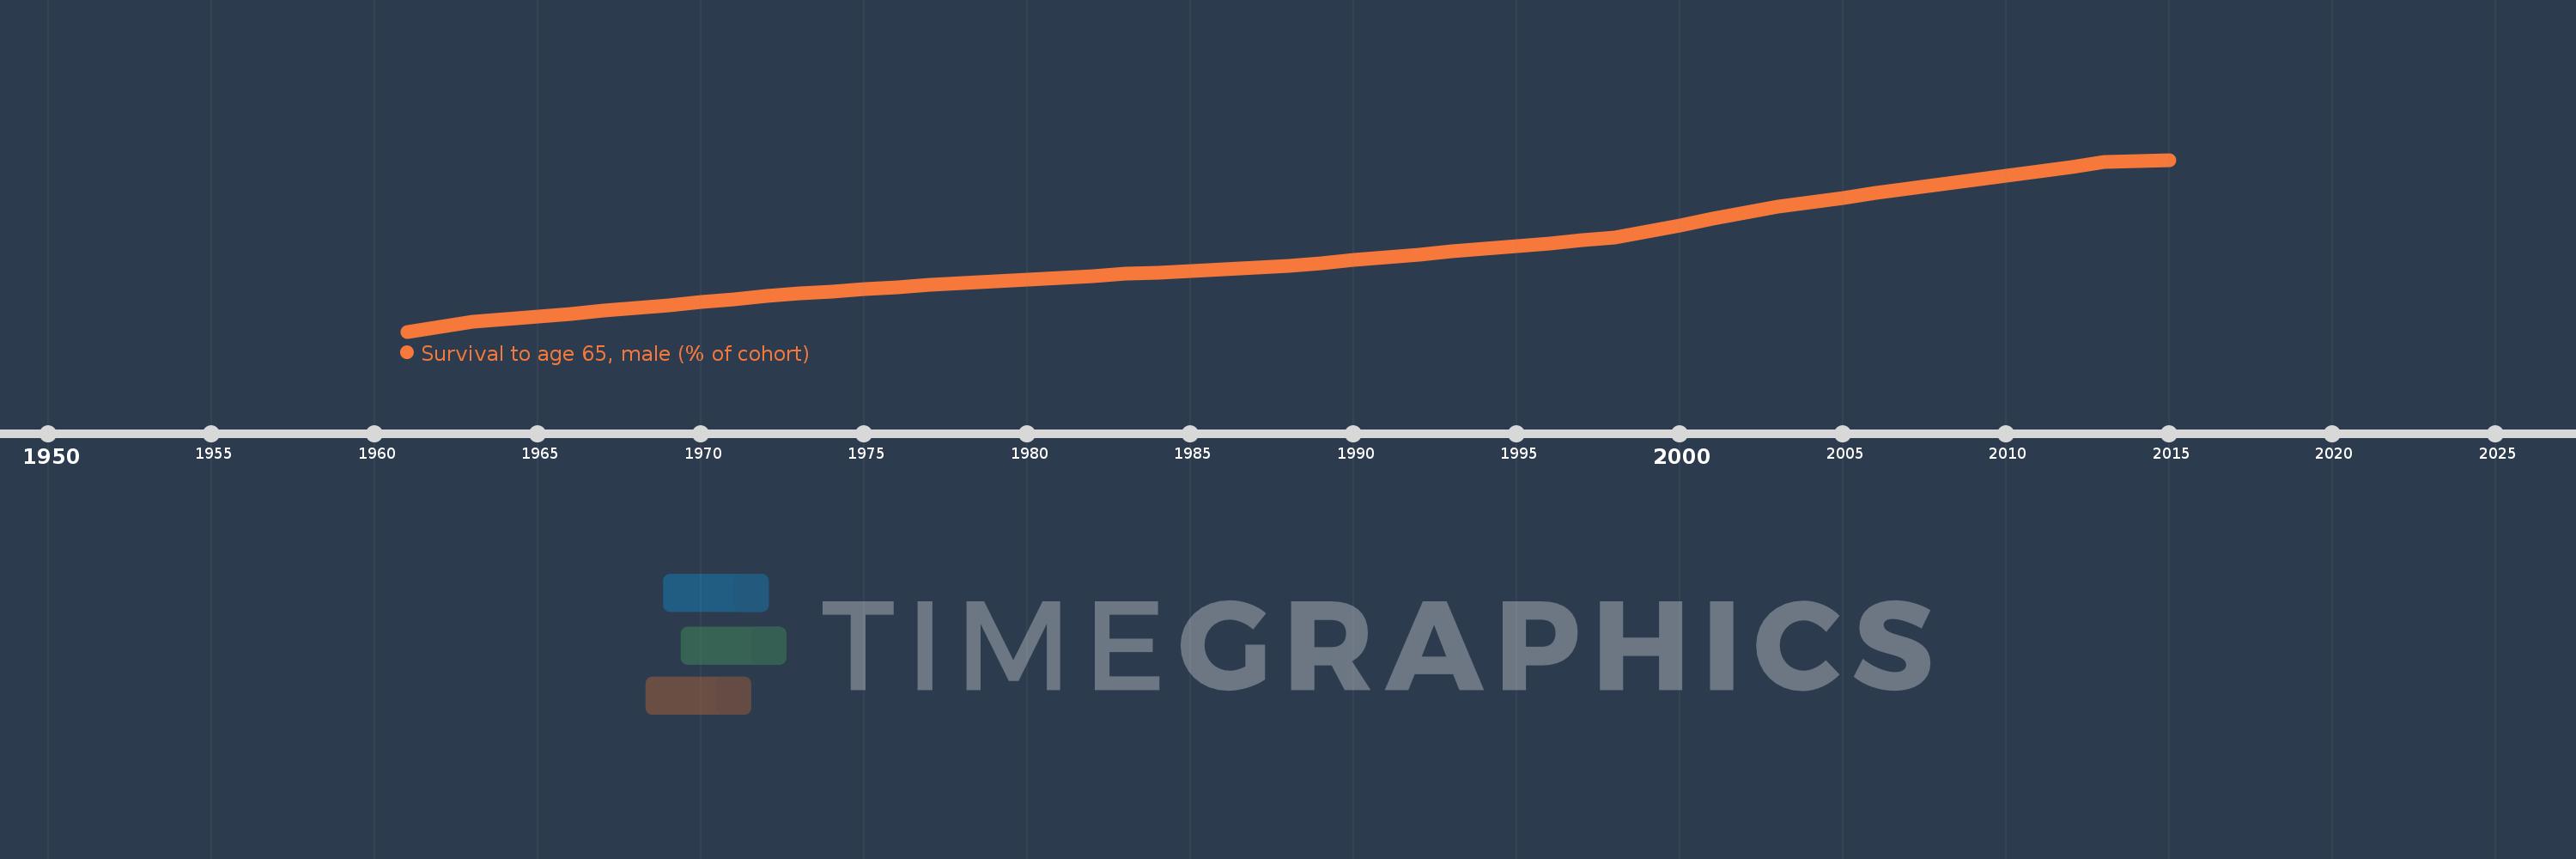
Survival to age 65, male (% of cohort)
2015,2014,2013,2012,2011,2010,2009,2008,2007,2006,2005,2004,2003,2002,2001,2000,1999,1998,1997,1996,1995,1994,1993,1992,1991,1990,1989,1988,1987,1986,1985,1984,1983,1982,1981,1980,1979,1978,1977,1976,1975,1974,1973,1972,1971,1970,1969,1968,1967,1966,1965,1964,1963,1962,1961
This statistics in other country:
AfghanistanAlbaniaAlgeriaAngolaAntigua and BarbudaArab WorldArgentinaArmeniaArubaAustraliaAustriaAzerbaijanBahamas, TheBahrainBangladeshBarbadosBelarusBelgiumBelizeBeninBhutanBoliviaBosnia and HerzegovinaBotswanaBrazilBrunei DarussalamBulgariaBurkina FasoBurundiCabo VerdeCambodiaCameroonCanadaCaribbean small statesCentral African RepublicCentral Europe and the BalticsChadChannel IslandsChileChinaColombiaComorosCongo, Dem. Rep.Congo, Rep.Costa RicaCote d'IvoireCroatiaCubaCuracaoCyprusCzech RepublicDenmarkDjiboutiDominican RepublicEarly-demographic dividendEast Asia & PacificEast Asia & Pacific (excluding high income)East Asia & Pacific (IDA & IBRD countries)EcuadorEgypt, Arab Rep.El SalvadorEquatorial GuineaEritreaEstoniaEthiopiaEuro areaEurope & Central AsiaEurope & Central Asia (excluding high income)Europe & Central Asia (IDA & IBRD countries)European UnionFijiFinlandFragile and conflict affected situationsFranceFrench PolynesiaGabonGambia, TheGeorgiaGermanyGhanaGreeceGrenadaGuamGuatemalaGuineaGuinea-BissauGuyanaHaitiHeavily indebted poor countries (HIPC)High incomeHondurasHong Kong SAR, ChinaHungaryIBRD onlyIcelandIDA & IBRD totalIDA blendIDA onlyIDA totalIndiaIndonesiaIran, Islamic Rep.IraqIrelandIsraelItalyJamaicaJapanJordanKazakhstanKenyaKiribatiKorea, Dem. People’s Rep.Korea, Rep.KuwaitKyrgyz RepublicLao PDRLate-demographic dividendLatin America & Caribbean Latin America & Caribbean (excluding high income)Latin America & the Caribbean (IDA & IBRD countries)LatviaLeast developed countries: UN classificationLebanonLesothoLiberiaLibyaLithuaniaLow & middle incomeLow incomeLower middle incomeLuxembourgMacao SAR, ChinaMacedonia, FYRMadagascarMalawiMalaysiaMaldivesMaliMaltaMauritaniaMauritiusMexicoMicronesia, Fed. Sts.Middle East & North AfricaMiddle East & North Africa (excluding high income)Middle East & North Africa (IDA & IBRD countries)Middle incomeMoldovaMongoliaMontenegroMoroccoMozambiqueMyanmarNamibiaNepalNetherlandsNew CaledoniaNew ZealandNicaraguaNigerNigeriaNorth AmericaNorwayOECD membersOmanOther small statesPacific island small statesPakistanPanamaPapua New GuineaParaguayPeruPhilippinesPolandPortugalPost-demographic dividendPre-demographic dividendPuerto RicoQatarRomaniaRussian FederationRwandaSamoaSao Tome and PrincipeSaudi ArabiaSenegalSerbiaSeychellesSierra LeoneSingaporeSlovak RepublicSloveniaSmall statesSolomon IslandsSomaliaSouth AfricaSouth AsiaSouth Asia (IDA & IBRD)South SudanSpainSri LankaSt. LuciaSt. Vincent and the GrenadinesSub-Saharan Africa Sub-Saharan Africa (excluding high income)Sub-Saharan Africa (IDA & IBRD countries)SudanSurinameSwazilandSwedenSwitzerlandSyrian Arab RepublicTajikistanTanzaniaThailandTimor-LesteTogoTongaTrinidad and TobagoTunisiaTurkeyTurkmenistanUgandaUkraineUnited Arab EmiratesUnited KingdomUnited StatesUpper middle incomeUruguayUzbekistanVanuatuVenezuela, RBVietnamVirgin Islands (U.S.)West Bank and GazaWorldYemen, Rep.ZambiaZimbabwe Timeline:
This timeline shows a graph from 1961 to 2015 of Paraguay. No data until 1960. Number of actual observations by date: 55.
Source name:
World Development Indicators
Source organization:
United Nations Population Division. World Population Prospects. New York, United Nations, Department of Economic and Social Affairs (advanced Excel tables). Available at http://esa.un.org/wpp/unpp/panel_population.htm.
Categories, topics:
Health, Gender
Last updated:
apr 23, 2017
Indicators value changes by year
Minimum:
61.469
jan 1, 1961
Maximum:
73.452
jan 1, 2015
At the date of observation
Value
Absolute change
Change from previous value
jan 1, 1961
61.469
+61.469
0.0%
jan 1, 1962
61.802
+0.333
0.54%
jan 1, 1963
62.135
+0.333
0.54%
jan 1, 1964
62.328
+0.193
0.31%
jan 1, 1965
62.521
+0.193
0.31%
jan 1, 1966
62.715
+0.193
0.31%
jan 1, 1967
62.908
+0.193
0.31%
jan 1, 1968
63.101
+0.193
0.31%
jan 1, 1969
63.308
+0.207
0.33%
jan 1, 1970
63.515
+0.207
0.33%
jan 1, 1971
63.722
+0.207
0.33%
jan 1, 1972
63.929
+0.207
0.32%
jan 1, 1973
64.136
+0.207
0.32%
jan 1, 1974
64.279
+0.143
0.22%
jan 1, 1975
64.422
+0.143
0.22%
jan 1, 1976
64.564
+0.143
0.22%
jan 1, 1977
64.707
+0.143
0.22%
jan 1, 1978
64.85
+0.143
0.22%
jan 1, 1979
64.978
+0.128
0.2%
jan 1, 1980
65.106
+0.128
0.2%
jan 1, 1981
65.233
+0.128
0.2%
jan 1, 1982
65.361
+0.128
0.2%
jan 1, 1983
65.489
+0.128
0.2%
jan 1, 1984
65.603
+0.114
0.17%
jan 1, 1985
65.718
+0.114
0.17%
jan 1, 1986
65.832
+0.114
0.17%
jan 1, 1987
65.947
+0.114
0.17%
jan 1, 1988
66.061
+0.114
0.17%
jan 1, 1989
66.26
+0.199
0.3%
jan 1, 1990
66.459
+0.199
0.3%
jan 1, 1991
66.659
+0.199
0.3%
jan 1, 1992
66.858
+0.199
0.3%
jan 1, 1993
67.057
+0.199
0.3%
jan 1, 1994
67.25
+0.193
0.29%
jan 1, 1995
67.443
+0.193
0.29%
jan 1, 1996
67.635
+0.193
0.29%
jan 1, 1997
67.828
+0.193
0.29%
jan 1, 1998
68.021
+0.193
0.28%
jan 1, 1999
68.455
+0.434
0.64%
jan 1, 2000
68.889
+0.434
0.63%
jan 1, 2001
69.324
+0.434
0.63%
jan 1, 2002
69.758
+0.434
0.63%
jan 1, 2003
70.192
+0.434
0.62%
jan 1, 2004
70.501
+0.309
0.44%
jan 1, 2005
70.81
+0.309
0.44%
jan 1, 2006
71.118
+0.309
0.44%
jan 1, 2007
71.427
+0.309
0.43%
jan 1, 2008
71.736
+0.309
0.43%
jan 1, 2009
72.044
+0.308
0.43%
jan 1, 2010
72.352
+0.308
0.43%
jan 1, 2011
72.661
+0.308
0.43%
jan 1, 2012
72.969
+0.308
0.42%
jan 1, 2013
73.277
+0.308
0.42%
jan 1, 2014
73.365
+0.088
0.12%
jan 1, 2015
73.452
+0.088
0.12%
Ranking of countries by current statistics by years


Comments: