29
/
en
AIzaSyAYiBZKx7MnpbEhh9jyipgxe19OcubqV5w
April 1, 2024
225430
Poland
POL
true
2
1
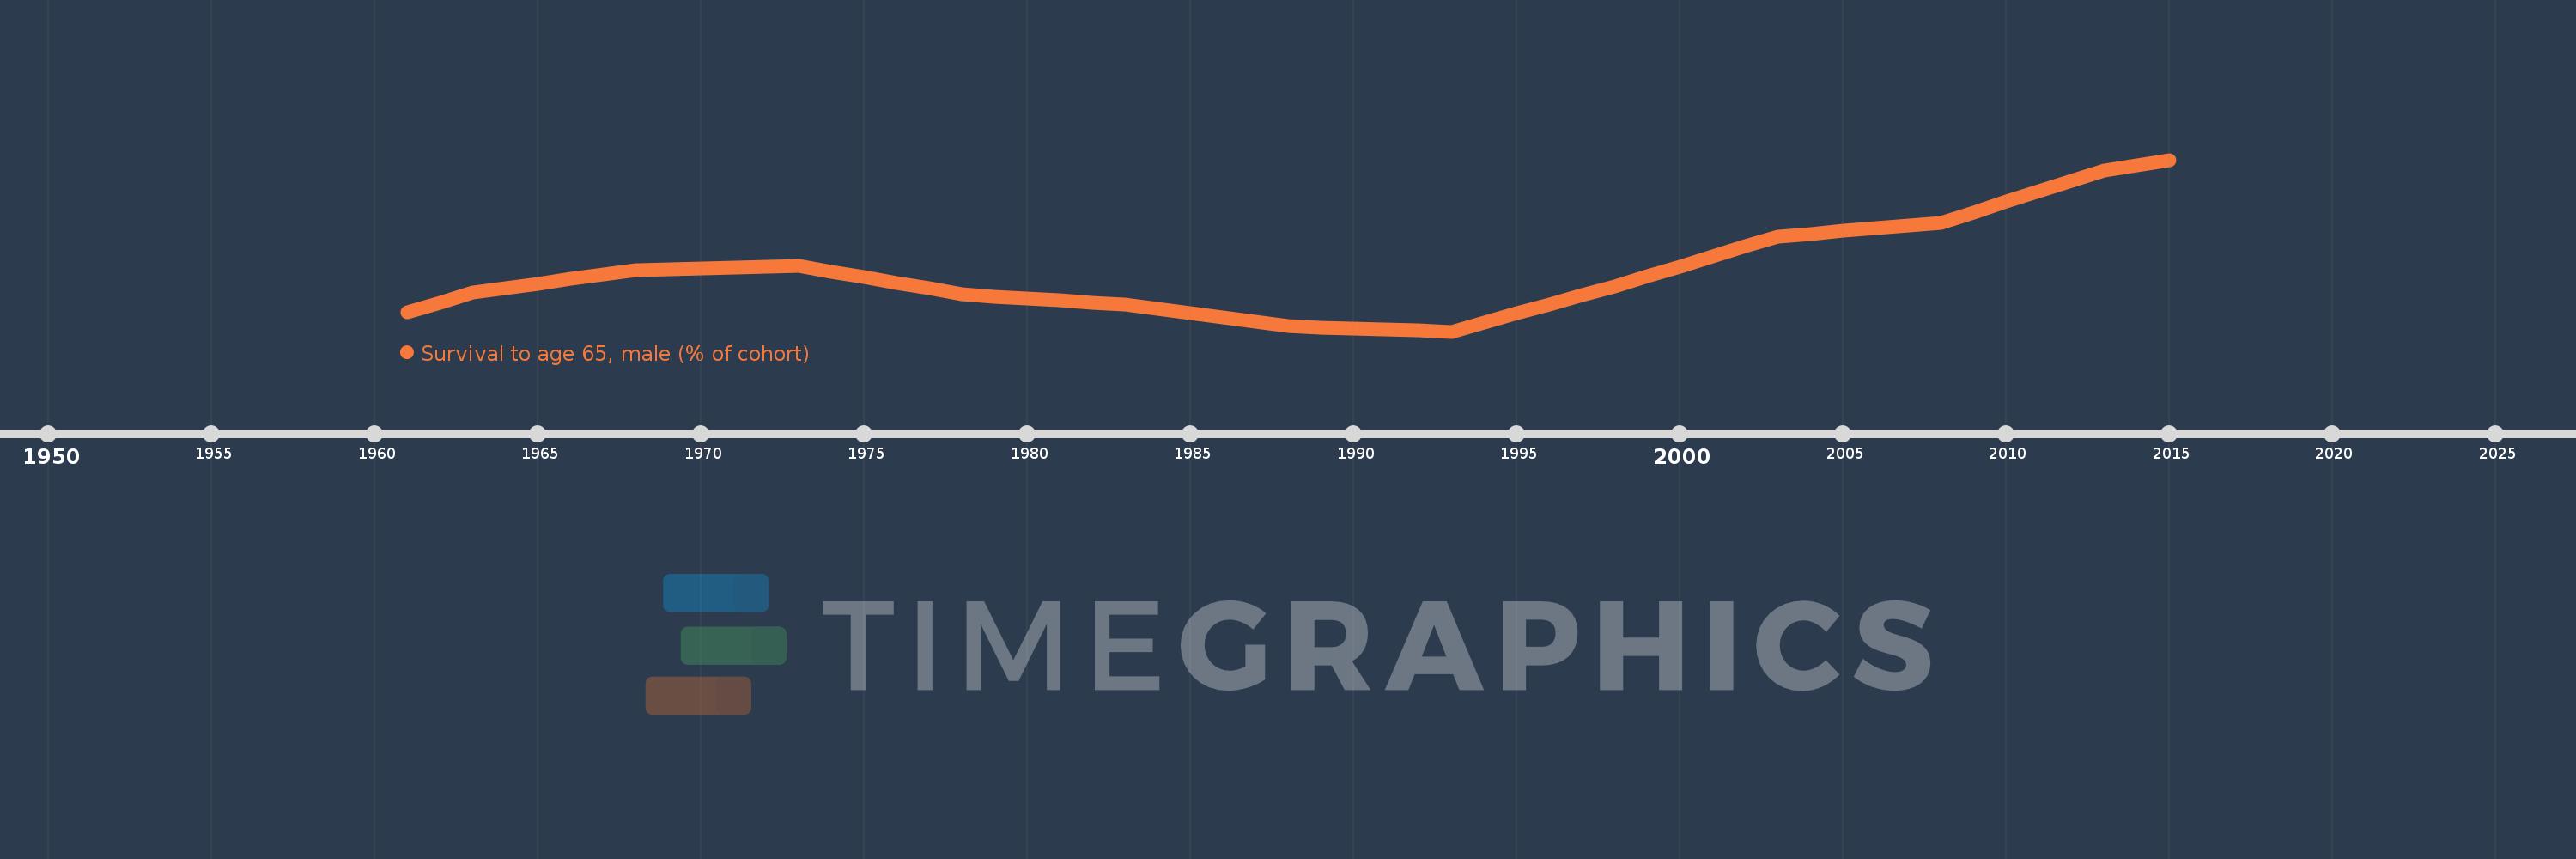
Survival to age 65, male (% of cohort)
2015,2014,2013,2012,2011,2010,2009,2008,2007,2006,2005,2004,2003,2002,2001,2000,1999,1998,1997,1996,1995,1994,1993,1992,1991,1990,1989,1988,1987,1986,1985,1984,1983,1982,1981,1980,1979,1978,1977,1976,1975,1974,1973,1972,1971,1970,1969,1968,1967,1966,1965,1964,1963,1962,1961
This statistics in other country:
AfghanistanAlbaniaAlgeriaAngolaAntigua and BarbudaArab WorldArgentinaArmeniaArubaAustraliaAustriaAzerbaijanBahamas, TheBahrainBangladeshBarbadosBelarusBelgiumBelizeBeninBhutanBoliviaBosnia and HerzegovinaBotswanaBrazilBrunei DarussalamBulgariaBurkina FasoBurundiCabo VerdeCambodiaCameroonCanadaCaribbean small statesCentral African RepublicCentral Europe and the BalticsChadChannel IslandsChileChinaColombiaComorosCongo, Dem. Rep.Congo, Rep.Costa RicaCote d'IvoireCroatiaCubaCuracaoCyprusCzech RepublicDenmarkDjiboutiDominican RepublicEarly-demographic dividendEast Asia & PacificEast Asia & Pacific (excluding high income)East Asia & Pacific (IDA & IBRD countries)EcuadorEgypt, Arab Rep.El SalvadorEquatorial GuineaEritreaEstoniaEthiopiaEuro areaEurope & Central AsiaEurope & Central Asia (excluding high income)Europe & Central Asia (IDA & IBRD countries)European UnionFijiFinlandFragile and conflict affected situationsFranceFrench PolynesiaGabonGambia, TheGeorgiaGermanyGhanaGreeceGrenadaGuamGuatemalaGuineaGuinea-BissauGuyanaHaitiHeavily indebted poor countries (HIPC)High incomeHondurasHong Kong SAR, ChinaHungaryIBRD onlyIcelandIDA & IBRD totalIDA blendIDA onlyIDA totalIndiaIndonesiaIran, Islamic Rep.IraqIrelandIsraelItalyJamaicaJapanJordanKazakhstanKenyaKiribatiKorea, Dem. People’s Rep.Korea, Rep.KuwaitKyrgyz RepublicLao PDRLate-demographic dividendLatin America & Caribbean Latin America & Caribbean (excluding high income)Latin America & the Caribbean (IDA & IBRD countries)LatviaLeast developed countries: UN classificationLebanonLesothoLiberiaLibyaLithuaniaLow & middle incomeLow incomeLower middle incomeLuxembourgMacao SAR, ChinaMacedonia, FYRMadagascarMalawiMalaysiaMaldivesMaliMaltaMauritaniaMauritiusMexicoMicronesia, Fed. Sts.Middle East & North AfricaMiddle East & North Africa (excluding high income)Middle East & North Africa (IDA & IBRD countries)Middle incomeMoldovaMongoliaMontenegroMoroccoMozambiqueMyanmarNamibiaNepalNetherlandsNew CaledoniaNew ZealandNicaraguaNigerNigeriaNorth AmericaNorwayOECD membersOmanOther small statesPacific island small statesPakistanPanamaPapua New GuineaParaguayPeruPhilippinesPolandPortugalPost-demographic dividendPre-demographic dividendPuerto RicoQatarRomaniaRussian FederationRwandaSamoaSao Tome and PrincipeSaudi ArabiaSenegalSerbiaSeychellesSierra LeoneSingaporeSlovak RepublicSloveniaSmall statesSolomon IslandsSomaliaSouth AfricaSouth AsiaSouth Asia (IDA & IBRD)South SudanSpainSri LankaSt. LuciaSt. Vincent and the GrenadinesSub-Saharan Africa Sub-Saharan Africa (excluding high income)Sub-Saharan Africa (IDA & IBRD countries)SudanSurinameSwazilandSwedenSwitzerlandSyrian Arab RepublicTajikistanTanzaniaThailandTimor-LesteTogoTongaTrinidad and TobagoTunisiaTurkeyTurkmenistanUgandaUkraineUnited Arab EmiratesUnited KingdomUnited StatesUpper middle incomeUruguayUzbekistanVanuatuVenezuela, RBVietnamVirgin Islands (U.S.)West Bank and GazaWorldYemen, Rep.ZambiaZimbabwe Timeline:
This timeline shows a graph from 1961 to 2015 of Poland. No data until 1960. Number of actual observations by date: 55.
Source name:
World Development Indicators
Source organization:
United Nations Population Division. World Population Prospects. New York, United Nations, Department of Economic and Social Affairs (advanced Excel tables). Available at http://esa.un.org/wpp/unpp/panel_population.htm.
Categories, topics:
Health, Gender
Last updated:
apr 23, 2017
Indicators value changes by year
Minimum:
62.342
jan 1, 1993
Maximum:
74.815
jan 1, 2015
At the date of observation
Value
Absolute change
Change from previous value
jan 1, 1961
63.719
+63.719
0.0%
jan 1, 1962
64.444
+0.725
1.14%
jan 1, 1963
65.17
+0.725
1.13%
jan 1, 1964
65.497
+0.327
0.5%
jan 1, 1965
65.824
+0.327
0.5%
jan 1, 1966
66.152
+0.327
0.5%
jan 1, 1967
66.479
+0.327
0.49%
jan 1, 1968
66.807
+0.327
0.49%
jan 1, 1969
66.869
+0.063
0.09%
jan 1, 1970
66.932
+0.063
0.09%
jan 1, 1971
66.994
+0.063
0.09%
jan 1, 1972
67.057
+0.063
0.09%
jan 1, 1973
67.12
+0.063
0.09%
jan 1, 1974
66.706
-0.414
-0.62%
jan 1, 1975
66.292
-0.414
-0.62%
jan 1, 1976
65.877
-0.414
-0.62%
jan 1, 1977
65.463
-0.414
-0.63%
jan 1, 1978
65.049
-0.414
-0.63%
jan 1, 1979
64.897
-0.152
-0.23%
jan 1, 1980
64.746
-0.152
-0.23%
jan 1, 1981
64.594
-0.152
-0.23%
jan 1, 1982
64.442
-0.152
-0.24%
jan 1, 1983
64.29
-0.152
-0.24%
jan 1, 1984
63.978
-0.312
-0.49%
jan 1, 1985
63.666
-0.312
-0.49%
jan 1, 1986
63.354
-0.312
-0.49%
jan 1, 1987
63.043
-0.312
-0.49%
jan 1, 1988
62.731
-0.312
-0.49%
jan 1, 1989
62.653
-0.078
-0.12%
jan 1, 1990
62.575
-0.078
-0.12%
jan 1, 1991
62.498
-0.078
-0.12%
jan 1, 1992
62.42
-0.078
-0.12%
jan 1, 1993
62.342
-0.078
-0.12%
jan 1, 1994
62.998
+0.655
1.05%
jan 1, 1995
63.653
+0.655
1.04%
jan 1, 1996
64.308
+0.655
1.03%
jan 1, 1997
64.963
+0.655
1.02%
jan 1, 1998
65.619
+0.655
1.01%
jan 1, 1999
66.344
+0.725
1.1%
jan 1, 2000
67.069
+0.725
1.09%
jan 1, 2001
67.794
+0.725
1.08%
jan 1, 2002
68.519
+0.725
1.07%
jan 1, 2003
69.244
+0.725
1.06%
jan 1, 2004
69.442
+0.198
0.29%
jan 1, 2005
69.64
+0.198
0.29%
jan 1, 2006
69.838
+0.198
0.28%
jan 1, 2007
70.036
+0.198
0.28%
jan 1, 2008
70.234
+0.198
0.28%
jan 1, 2009
70.999
+0.765
1.09%
jan 1, 2010
71.764
+0.765
1.08%
jan 1, 2011
72.528
+0.765
1.07%
jan 1, 2012
73.293
+0.765
1.05%
jan 1, 2013
74.058
+0.765
1.04%
jan 1, 2014
74.436
+0.379
0.51%
jan 1, 2015
74.815
+0.379
0.51%
Ranking of countries by current statistics by years


Comments: